...
The plots below shows EFI and SOT for 3-day precipitation (7 August 00UTC - 11 August 00UTC) from different initial dates.


The plot below shows the forecast evolution plot for 72-hour precipitation (7 August 00UTC - 11 August 00UTC) for 2 degree box over southern Norway (see plots above). Mean of observations - green hourglass, concatenated 6-hour forecasts - green dot, HRES –red, ENS blue box-and-whisker, Model climate – cyan box-and-whisker. Ensemble mean as black diamonds. Triangle marks the maximum in the model climate based on 1800 forecasts.

3.4 Monthly forecasts
The plots below show the 7-day precipitation anomaly for 7-13 August from different initial dates.


3.5 Comparison with other centres
3.6 EFAS
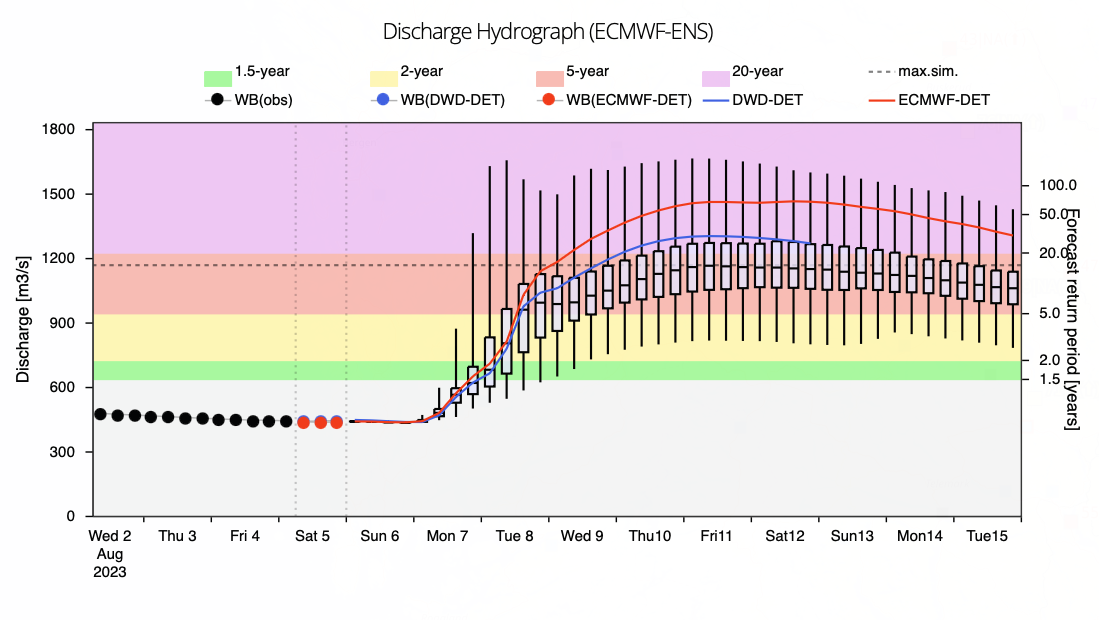
The plots below show the river discharge for river Drammen close to the city of Drammen.


4. Experience from general performance/other cases
...