Status:Ongoing analysis Material Status: Finalised Material from: Linus, Fernando
...
| Show If | ||
|---|---|---|
| ||
Discussed in the following Daily reports: |
Picture
1. Impact
| Excerpt |
|---|
Tropical cyclone Irma hit several countries along its swath in the Caribbean. On 5-6 September TC Irma made its first landfall on some of the Leeward Islands. The first to be hit was Barbuda as a Category 5 cyclone and later on 6 September on St. Barthélemy, Saint Martin/Sint Marteen and Anguilla. All these islands were within the eyewall of the cyclone and wind gusts up to 70 m/s was reported on Barbuda. The cyclone later hit Virgin Islands, Turks and Caicos Islands and also affected Puerto Rico and Hispaniola. On 8 September the cyclone hit the Bahamas and made landfall on Cuba 8-9 September, also here as a category 5 cyclone. Finally the cyclone made landfall on the southern tip of Florida on 10 September |
2. Description of the event
3. Predictability
3.1 Data assimilation
...
The plots below show observation statistics for MSLP along the track of Irma with 1 (left) and 5 degrees (right).


The plots below show the same as above put for temperature observations from drop sondes.


3.2 HRES
3.3 ENS
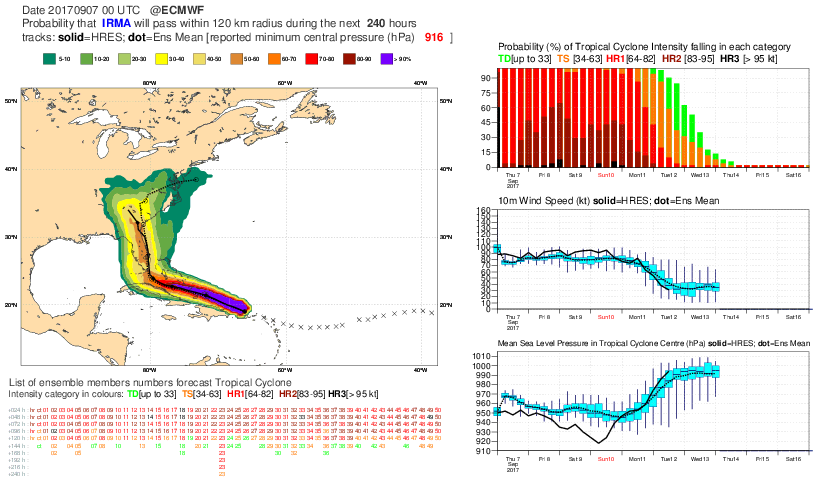
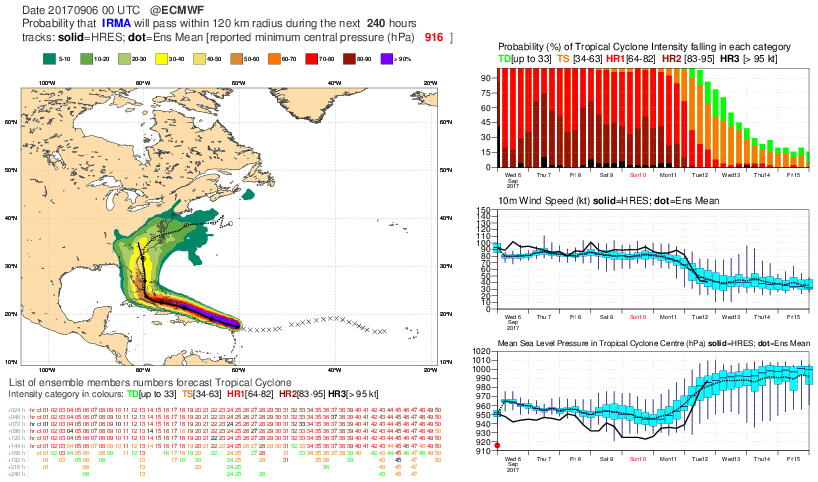
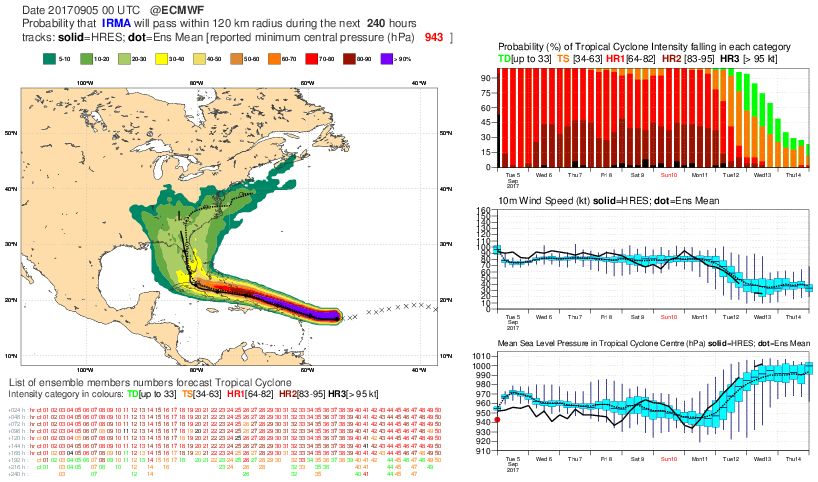
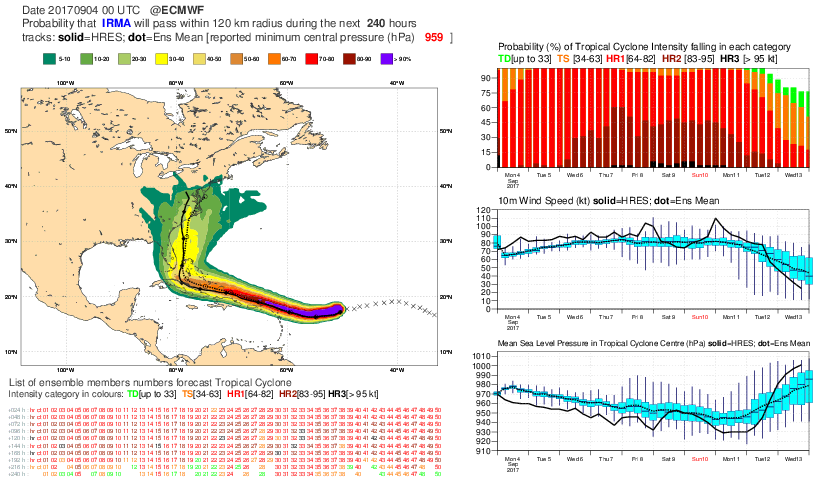
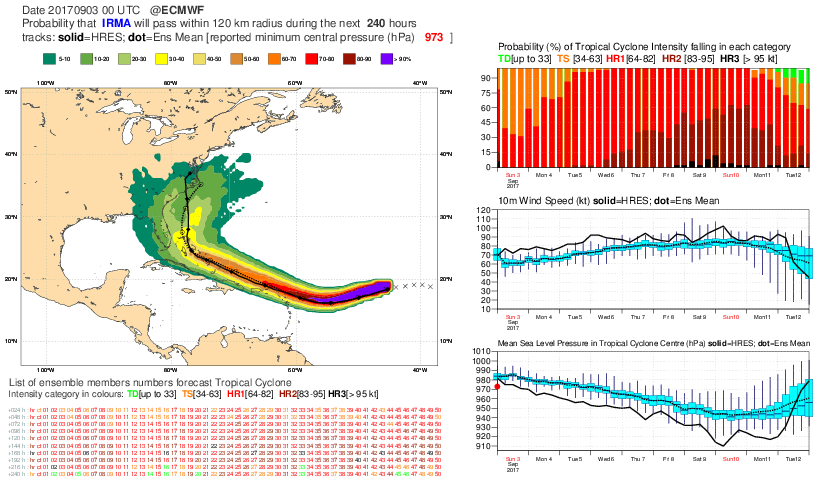
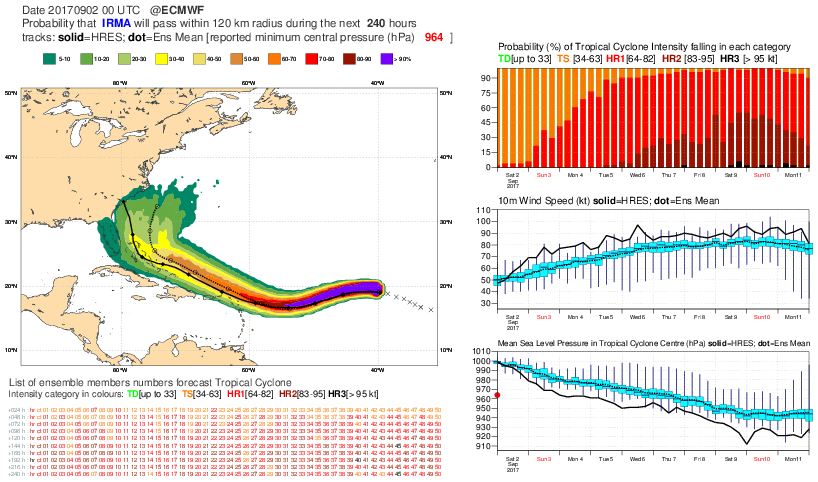
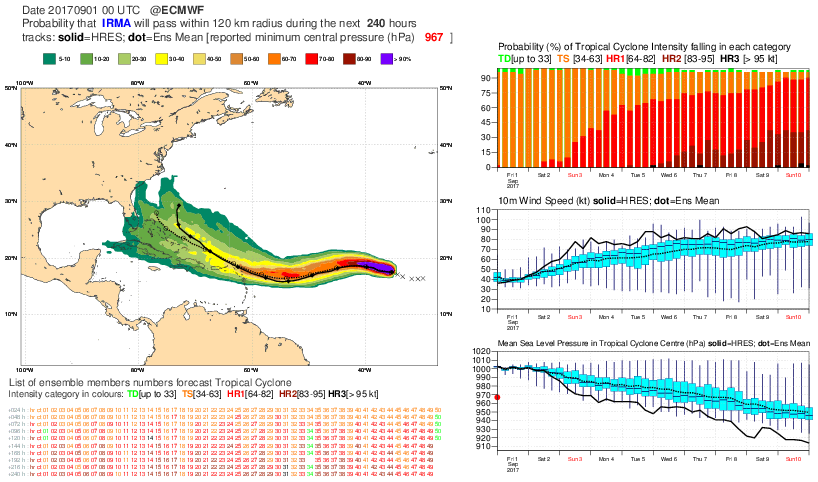
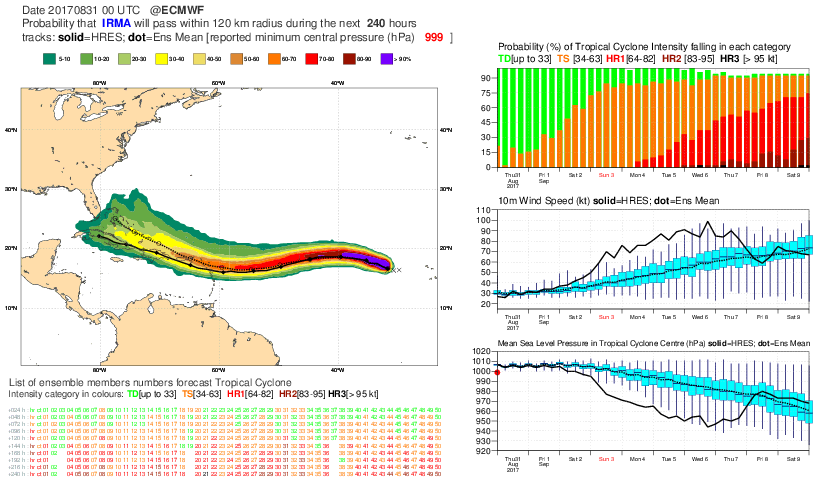
The plots below show tropical cyclone product for TC Irma (from 00z runs starting from the last run).


The plot below shows the evolution of our forecasts for the landfall on Florida. The figure shows the longitude of each ensemble members (blue), HRES (red) and control forecast (green) at the time they crossed 25N (height of Miami). The size of each dot is scaled to the strength of the cyclone at the crossing time. I have also included the observed point (black) and the width of Florida (dashed lines).

The plot below shows the evolution of ensemble and HRES forecasts for 48-hour maximum wind gusts (5 September 00z to 7 September 00z) for Sint Marteen/Saint Martin.

The plot below shows the evolution of ensemble and HRES forecasts for 48-hour maximum wind gusts (10 September 00z to 12 September 00z) for Key West.

3.4 Monthly forecasts
The plots below show the tropical storm activity for the week of 28 August - 3 September, when TC Irma formed west of Kap Verde. During the week the tropical depression that later became TC Jose was also present in the region. The increased activity was somehow captured from 21 August but clearly from 24 August - a week before the cyclogenesis of TC Irma. However, at this stage the track was very uncertain.


3.5 Comparison with other centres
...
4. Experience from general performance/other cases
...
5. Good and bad aspects of the forecasts for the event
Gust forecasts for western Florida at short range were far too high. This was not due to an excessive contribution from the convection-related gust contribution. This very curious finding is subject to further investigation at ECMWF.