Status:Ongoing analysis Material from: Linus, Fernando
Picture
1. Impact
2. Description of the event
3. Predictability
3.1 Data assimilation
3.2 HRES
3.3 ENS
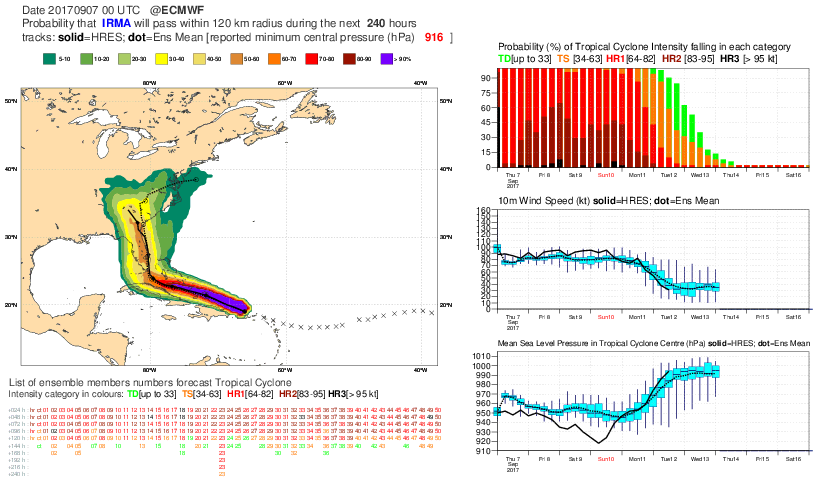
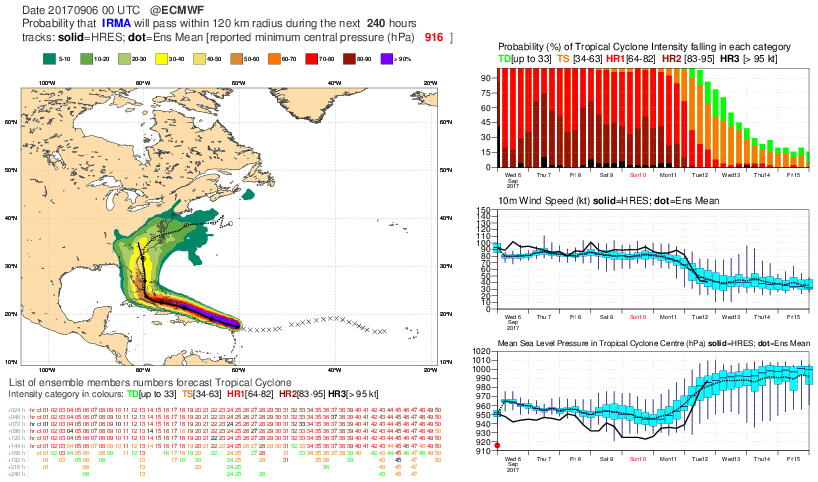
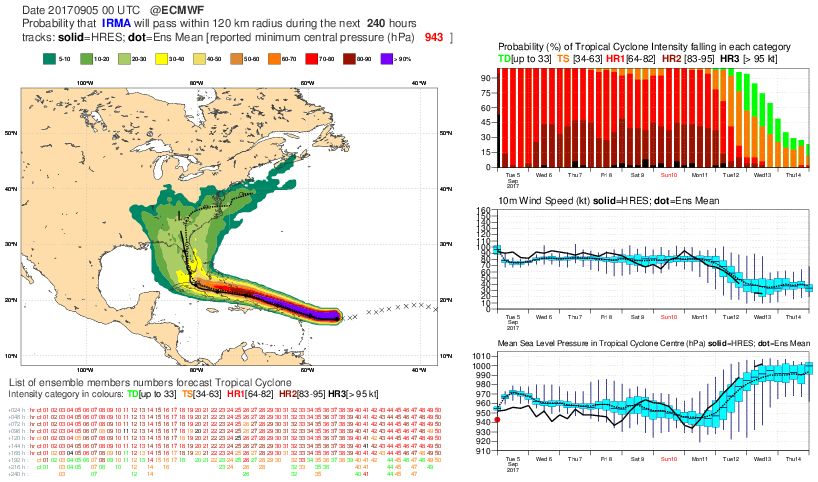
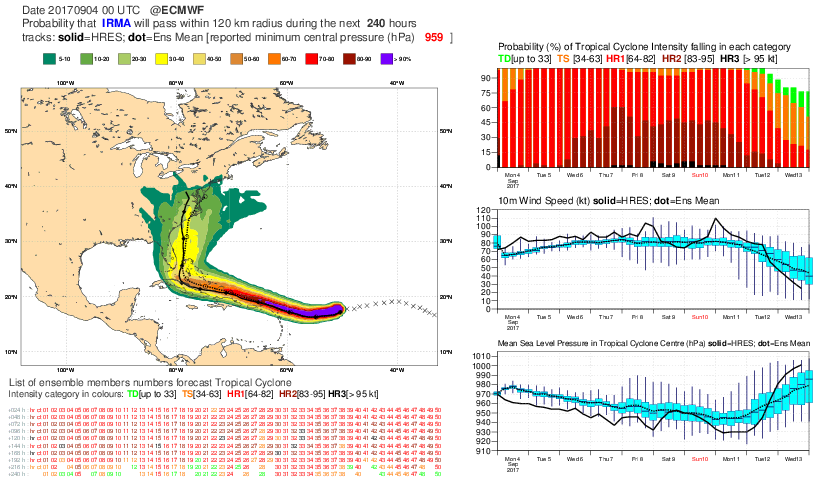
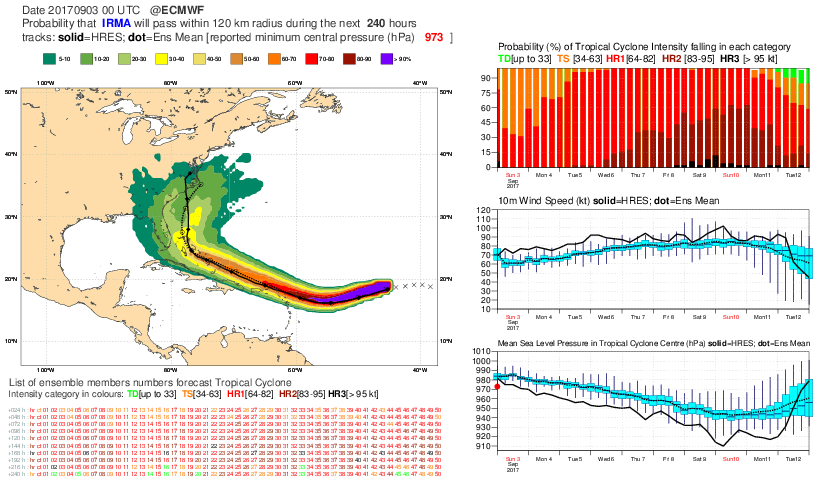
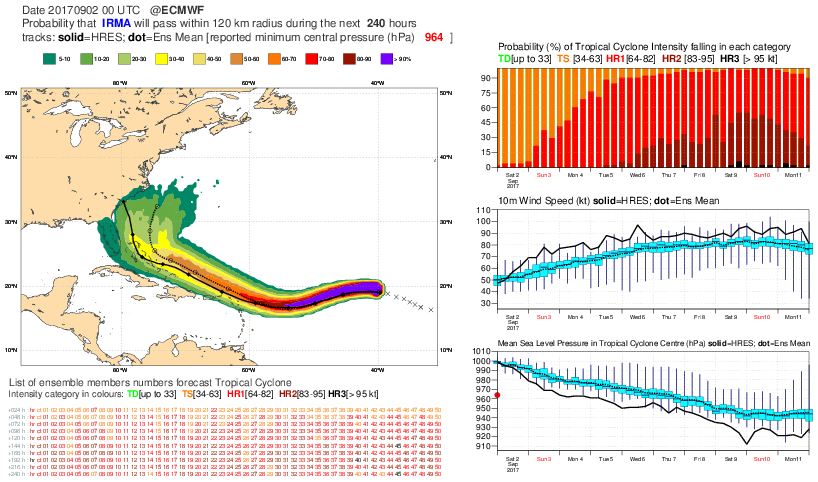
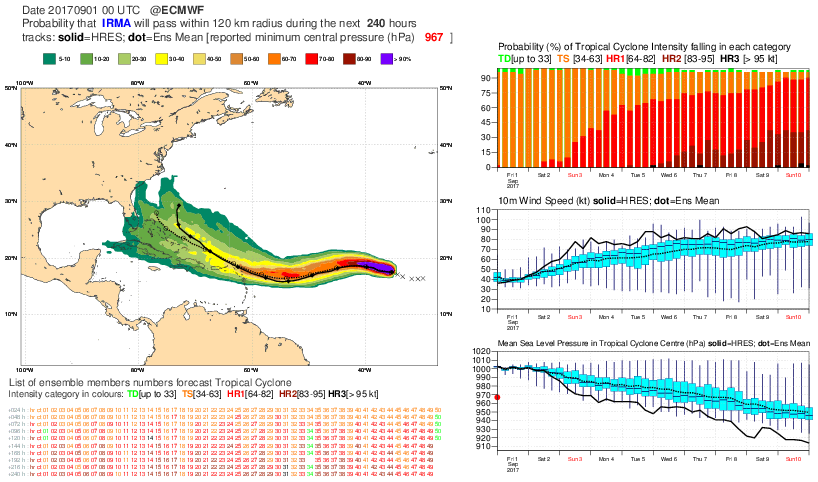
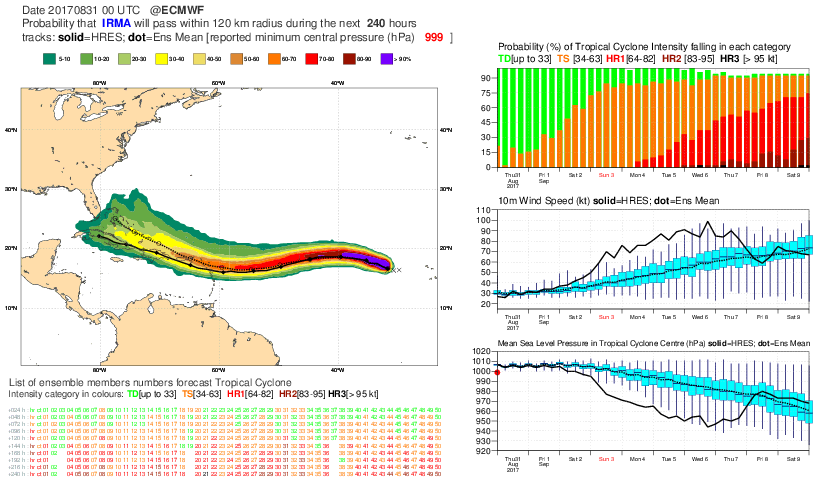
The plots below show tropical cyclone product for TC Irma (from 00z runs starting from the last run).
3.4 Monthly forecasts
3.5 Comparison with other centres
4. Experience from general performance/other cases