Status:Ongoing analysis Material Status: Finalised Material from: Linus, Ivan
| Show If | ||
|---|---|---|
| ||
Discussed in the following Daily reports: |
1. Impact
With the arrival of the summer monsoon, torrential rain triggered mudslides and devastating floods in western and southern parts of Sri Lanka. Sri Lanka’s Disaster Management Centre reported that 91 people have been killed with 110 others missing as of Friday evening local time. More than 480 homes have sustained at least partial damage with nearly 17,000 families affected.
...
2. Description of the event
The plots below show geostationary satellite images from 24, 25 and 26 May (all 06z). Convections was present on southern Ski Lanka on all three days.


We are missing precipitation observations from Sri Lanka.The observations below are instead from ogimet.com with the first plot valid on 20 May (20May 00z- 21 May 00z) and last 31 May. The worst precipitation episode in south-eastern Sri Lanka took place on 24-26 May with 535 mm at one station.Ratnapura (6.7N, 80.4W)


 28 May missing

The plots below show the precipitation from HRES during the first 24 hours, as a proxy for the analysis. It is apparent that the short forecasts missed clearly underestimated the events event between 24-26 May, while it had heavy precipitation on 29-30 May, which seems to have been higher than observed.
...
3.1 Data assimilation
3.2 HRES
3.3 ENS
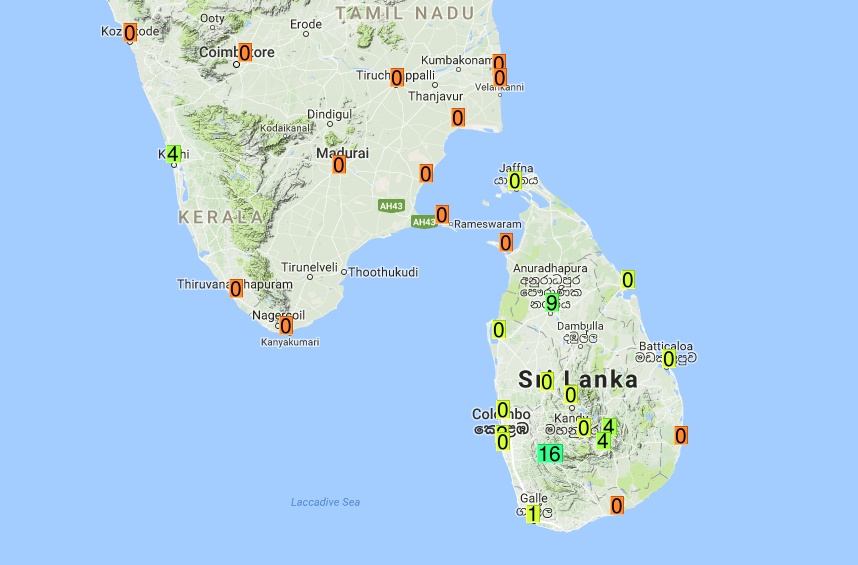
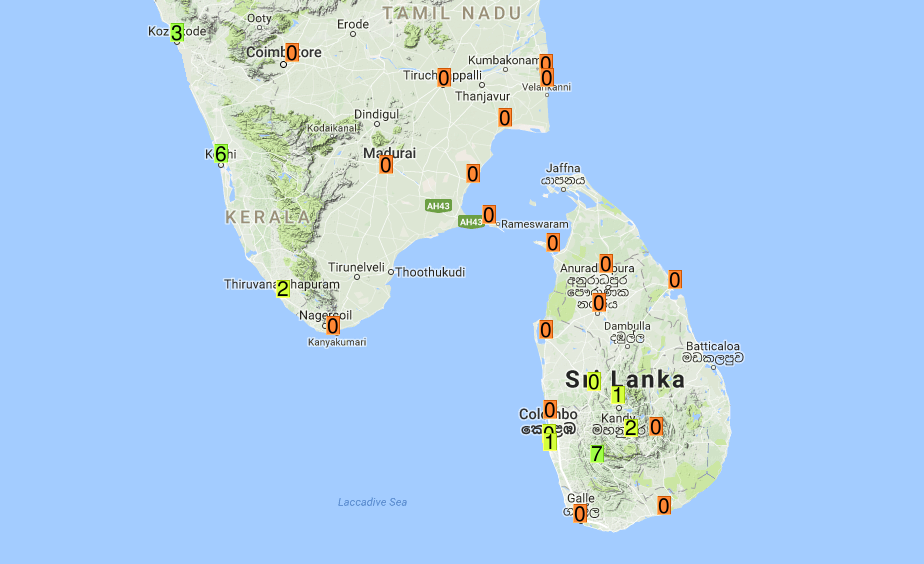
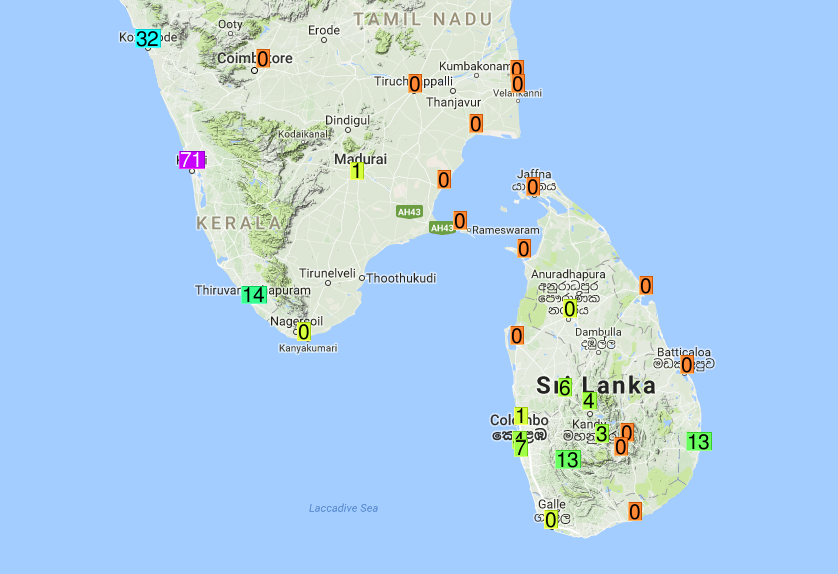
The plots below show EFI for precipitation for 24-26 May (3 days).


The plot below shows the evolution of forecasts of 3-day accumulated rainfall in Ratnapura valid 24-26 May. The blue box-and-whisker shows the ensemble distribution, the red dot the HRES forecast and the red box-and-whisker the climate distribution based on re-forecasts. The observed value was 535 mm, which is actually inside the ensemble distribution of the last forecast. Already the forecasts from 12 days before the event predicted a wet anomaly, but the uncertainty was large also for the shortest forecasts.

3.4 Monthly forecasts
The plot below shows the verification of precipitation anomalies in the monthly forecasts valid for the week 22-28 May. The forecasts shows enhanced precipitation in the Indian Ocean. Please note that the analysis is based on short forecasts that we found above also missed the precipitation event on southern Sri Lanka.

The plot below shows the MJO diagram from 29 May (plots from earlier forecasts would be good to include). A MJO was active in the Indian Ocean during the event.

3.5 Comparison with other centres
...
4. Experience from general performance/other cases
201605 - Tropical cyclone - ROANU
5. Good and bad aspects of the forecasts for the event
- The short and medium-range forecasts clearly underestimated the precipitation on 24-26 May, but the outcome was covered in the ensemble distribution from the last forecast.
- Some signal in monthly forecasts (connected to MJO?)
- Weak signal in EFI, due to "extreme" climatology
- Observations missing from Sri Lanka in our system but available on the web