Status:Ongoing analysis Material from: Linus
Picture
1. Impact
On 4 September the super-typhoon Jebi hit Japan as the worst typhoon in the past 25 years. The cyclone made landfall close to Osaka.
https://www.bbc.co.uk/news/world-asia-45406857
2. Description of the event
3. Predictability
3.1 Data assimilation
3.2 HRES
3.3 ENS
The plots below show the tracks (ensemble -grey, best track - black), position and intensity on 4 September 00UTC (ensemble - squares, best track - hourglass) in forecasts from 4 September (first plot) to 23 August (last plot). Note that the cyclone formed on 28 August.


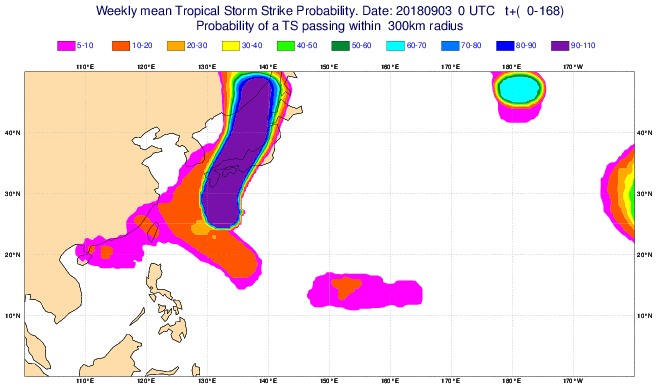
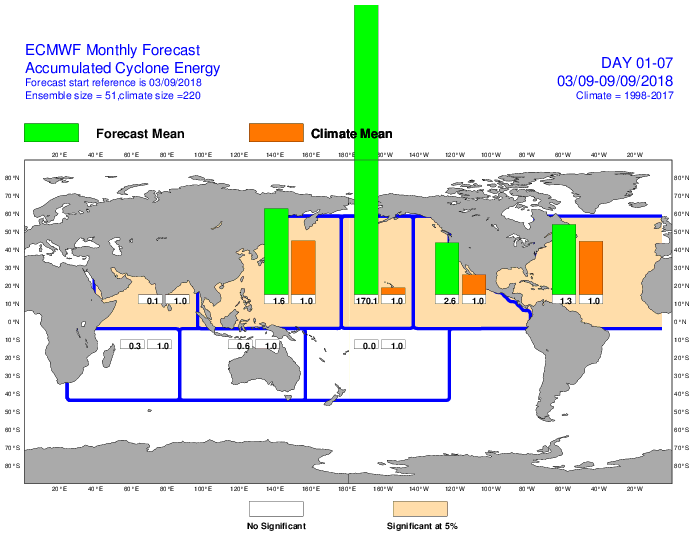
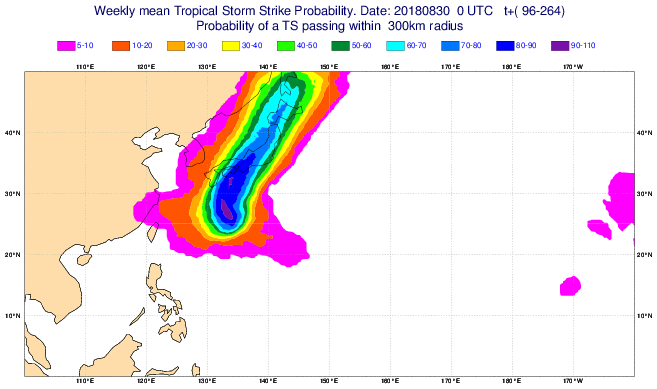
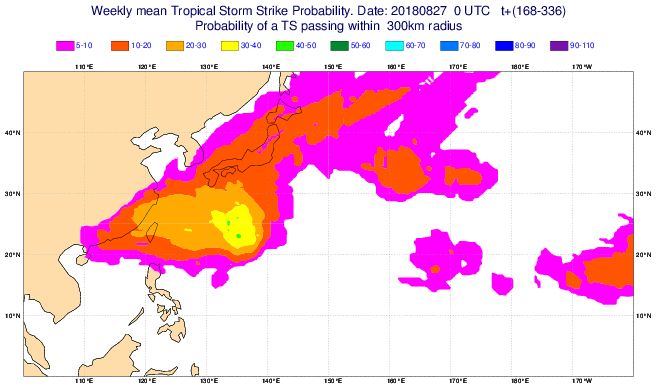
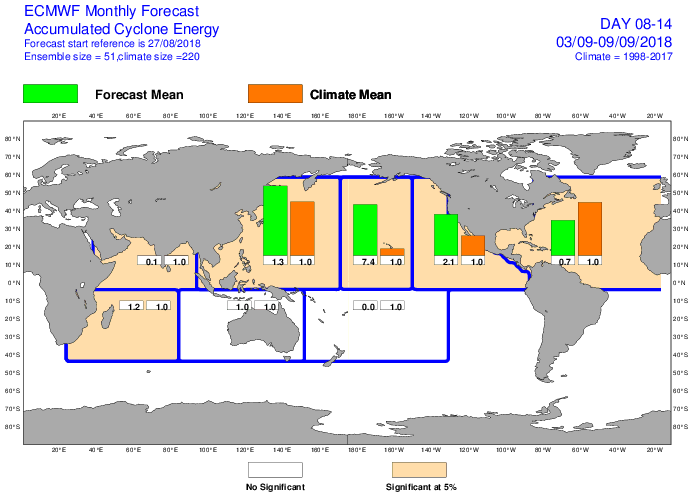
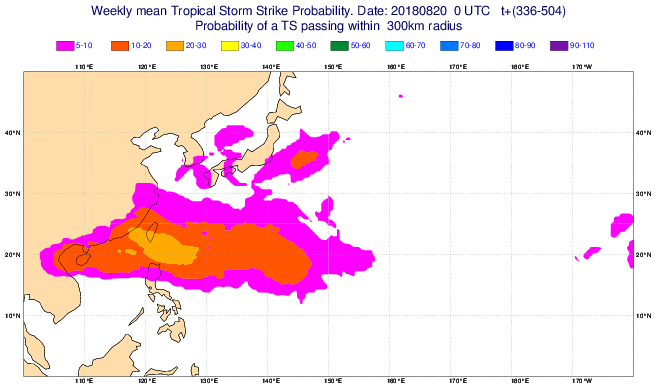
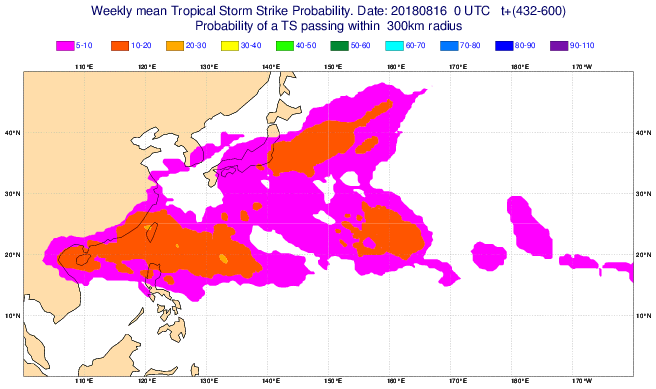
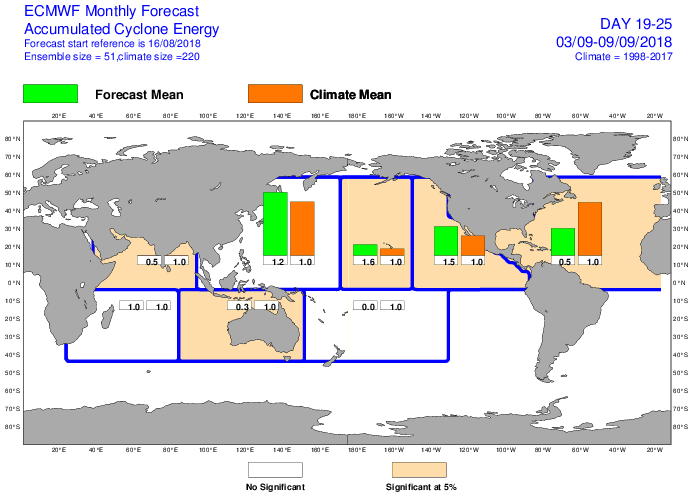
3.4 Monthly forecasts
The plots below show weekly strike probability (left) and normalised accumulated cyclone energy from extended-range forecasts.


3.5 Comparison with other centres
4. Experience from general performance/other cases