Status:Ongoing analysis Material from: Linus, Esti, Tim, Philippe
1. Impact
On 9 October torrential rainfall hit parts of Majorca and killed at least 10 people. Locally more than 200 mm of rain was reported.
https://www.bbc.co.uk/news/world-europe-45807978
2. Description of the event
The plots below show analyses of MSLP and short forecasts of 6-hour total precipitation covering 7 October 00UTC to 10 October 00UTC, every 12th hour.


The plot below shows HRES 12 h total precipitation. Base time 9th October 2018 at 00 UTC and valid on 10th October 2018 at 00 UTC. CDF 24h precipitation in a point close to the station where the maximum precipitation was registered.

The plots below show analyses of z500 (contour) and T850 (shade) covering 7 October 00UTC to 10 October 00UTC, every 12th hour.


The plots below show observations of total precipitation in 24 h and radar image and station reports.


Lightning observations and Baleares radar image at peak time:
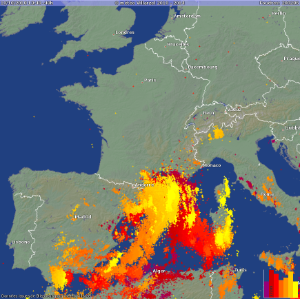

The animated OPERA radar below shows no clear evidence of any orographic triggering or enhancement of the rainfall rates. Instead there are several examples of quasi-stationary triggering points over the ocean, which are probably maintained, temporarily, by back-building (where convective outflow meets inflow, gives convergence, which fuels more convection). These seem to have fed the prolonged extreme rainfall rates in the afflicted area. There was evidence on satellite imagery of a very similar process in and around the all-time-record Hawaii rainfall event (>1000mm in 24h) earlier in 2018. It would be good to uncover what aspects of an atmospheric vertical profile can be conducive to such back-building. The HRES analysed profiles for relevant locations (relative to radar) are also shown below. There is evidence on both of some near-unidirectional lower tropospheric shear, which may be conducive, as discussed here (see "Excessive Rainfall" section near the end). However a factor also of note, for forecasting, is that the short range forecast profiles for these times do not show this characteristic as well as these analysis profiles do.


3. Predictability
3.1 Data assimilation
3.2 HRES
The first plots below shows (not yet) observations of 24-hour precipitation 9 October 06z to 10 October 06z and the following plots HRES forecasts from different initial times valid the same time. The plots also includes MSLP valid at 18UTC on 9 October.


3.3 ENS
The plots below show EFI and SOT for 24-hour precipitation (9 October).


The panel plot below show Lightning density, EFI CAPE and EFI CAPE-SHEAR for day 2 and severe weather report valid for 9th October 2018. .

Comparison of a the raw ensemble CDF in the maximum precipitation point with the point rainfall in the same point for 12h precipitation forecast. Base time 9th October 2018 and valid at lead time 24 h.

3.4 Monthly forecasts
3.5 Comparison with other centres
Below is HARMONIE-AROME (from Aemet) 12 h precipitation forecast for western Mediterranean. Base time 9th October at different runs (00, 06 and 18 UTC).

Below is the ARMONIE (from MeteFrance) 1-hourly precipitation forecast for western Mediterranean. Base time 9th October and valid at 18:00 and 19:00 local time.

4. Experience from general performance/other cases
- The forecast clearly missed the peak intensity of the event