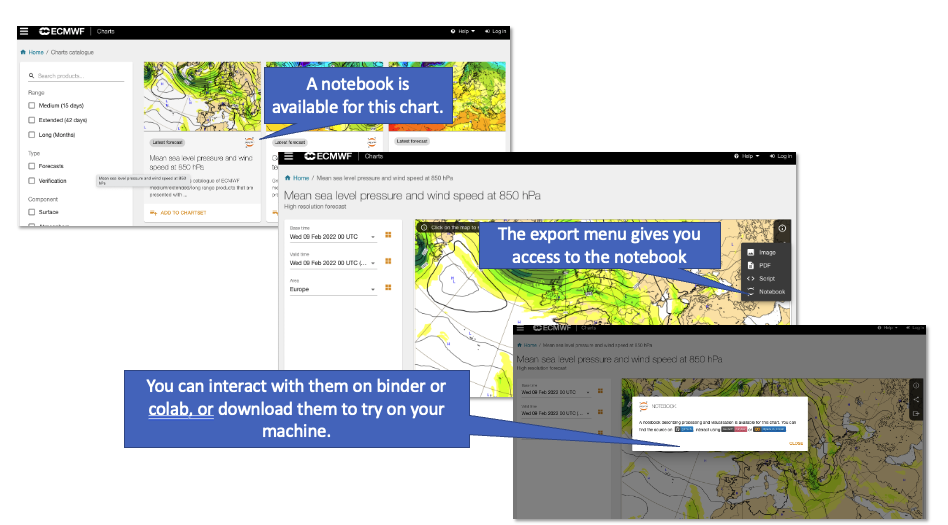
Latest News (25 January 2022) : Jupyter notebooks available
We are providing Jupiter Notebooks for some of our plots: you can identify them with the Jupiter logo.
They explain how you can get the data, which process we apply to them and how we visualise them.
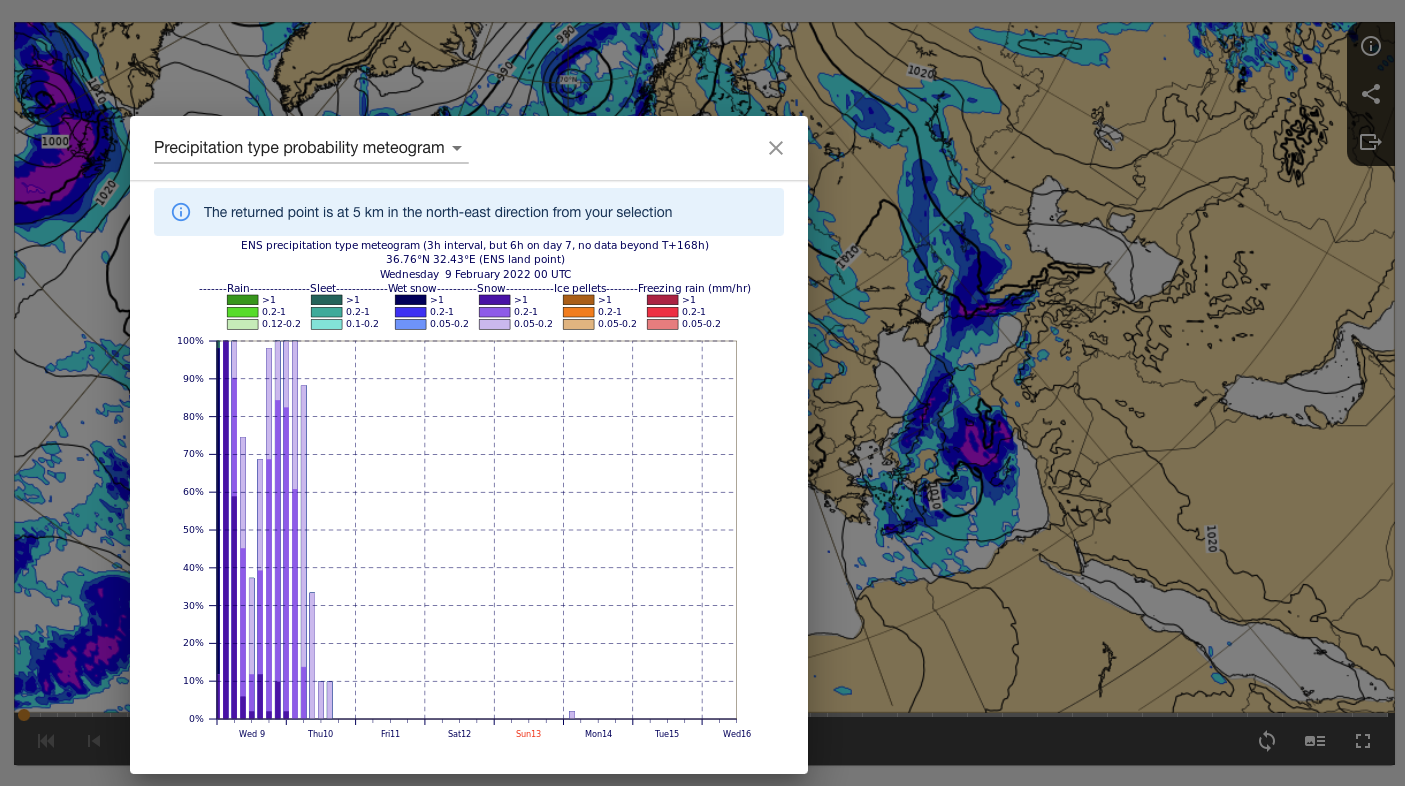
Latest News (25 January 2022) : Precipitation type available
A new location based product is available: The precipitation type probability meteogram from any where on a map or on the location you prefer

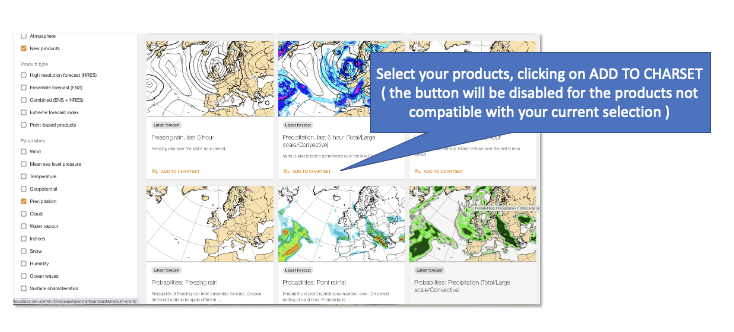
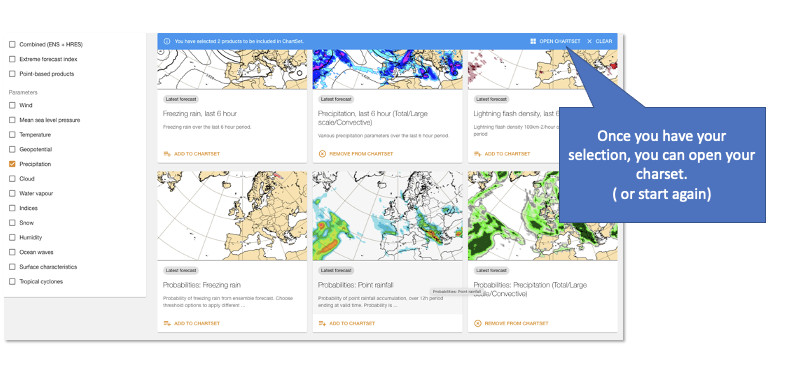
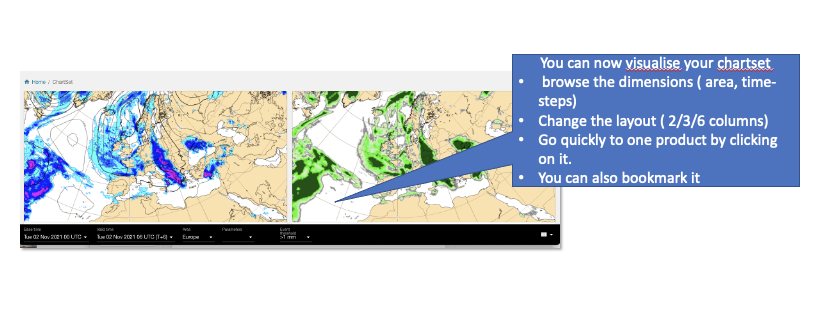
November 2021 : A new charset
A new feature, the ChartSet, allows you to create a set of charts: once created you can visualise them together and change the common dimensions in one single selection.
To get the best experience of this new feature, we have grouped the products sharing the same dimensions together. For example, you can choose to combine products from all the ones marked as Latest forecast.
But, let's have a tour :
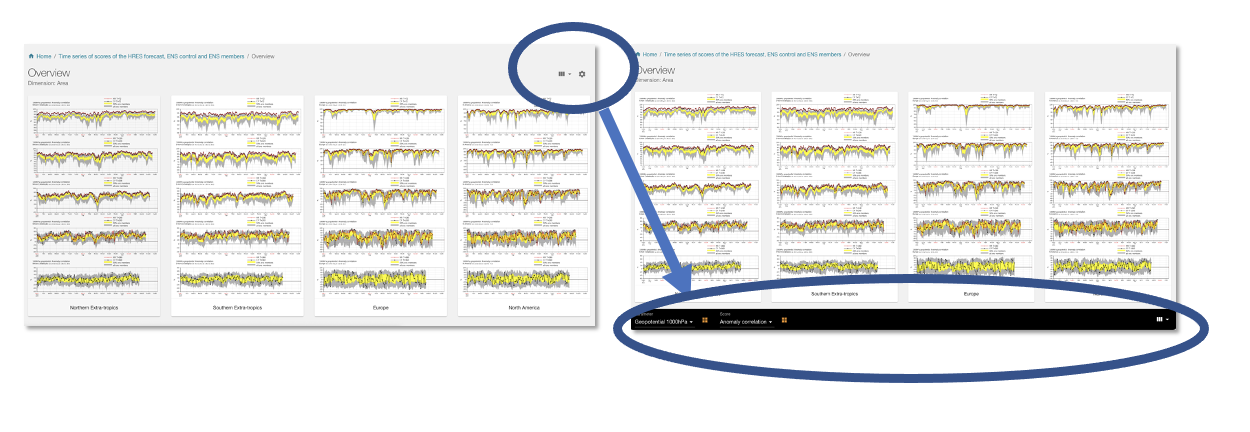
Change in the overview :
We have slightly changed the layout of the overview to align it to the Chartset layout.
Here is what we changed:

September 2021 : API is now available
An API to automatically download products using standard tools such as curl or requests in Python: we welcome your feedback.

- An Overview functionality for comparing forecasts by dimensions

- Improvements of choosing the location on Point base products (Meteograms, Plumes, EFI/CDF) including the recent 10 locations history and using current location

- Small improvements in displaying long dimension names
May 2021:
- Products can now be downloaded in PDF.
The new openchart application was launched in October 2020
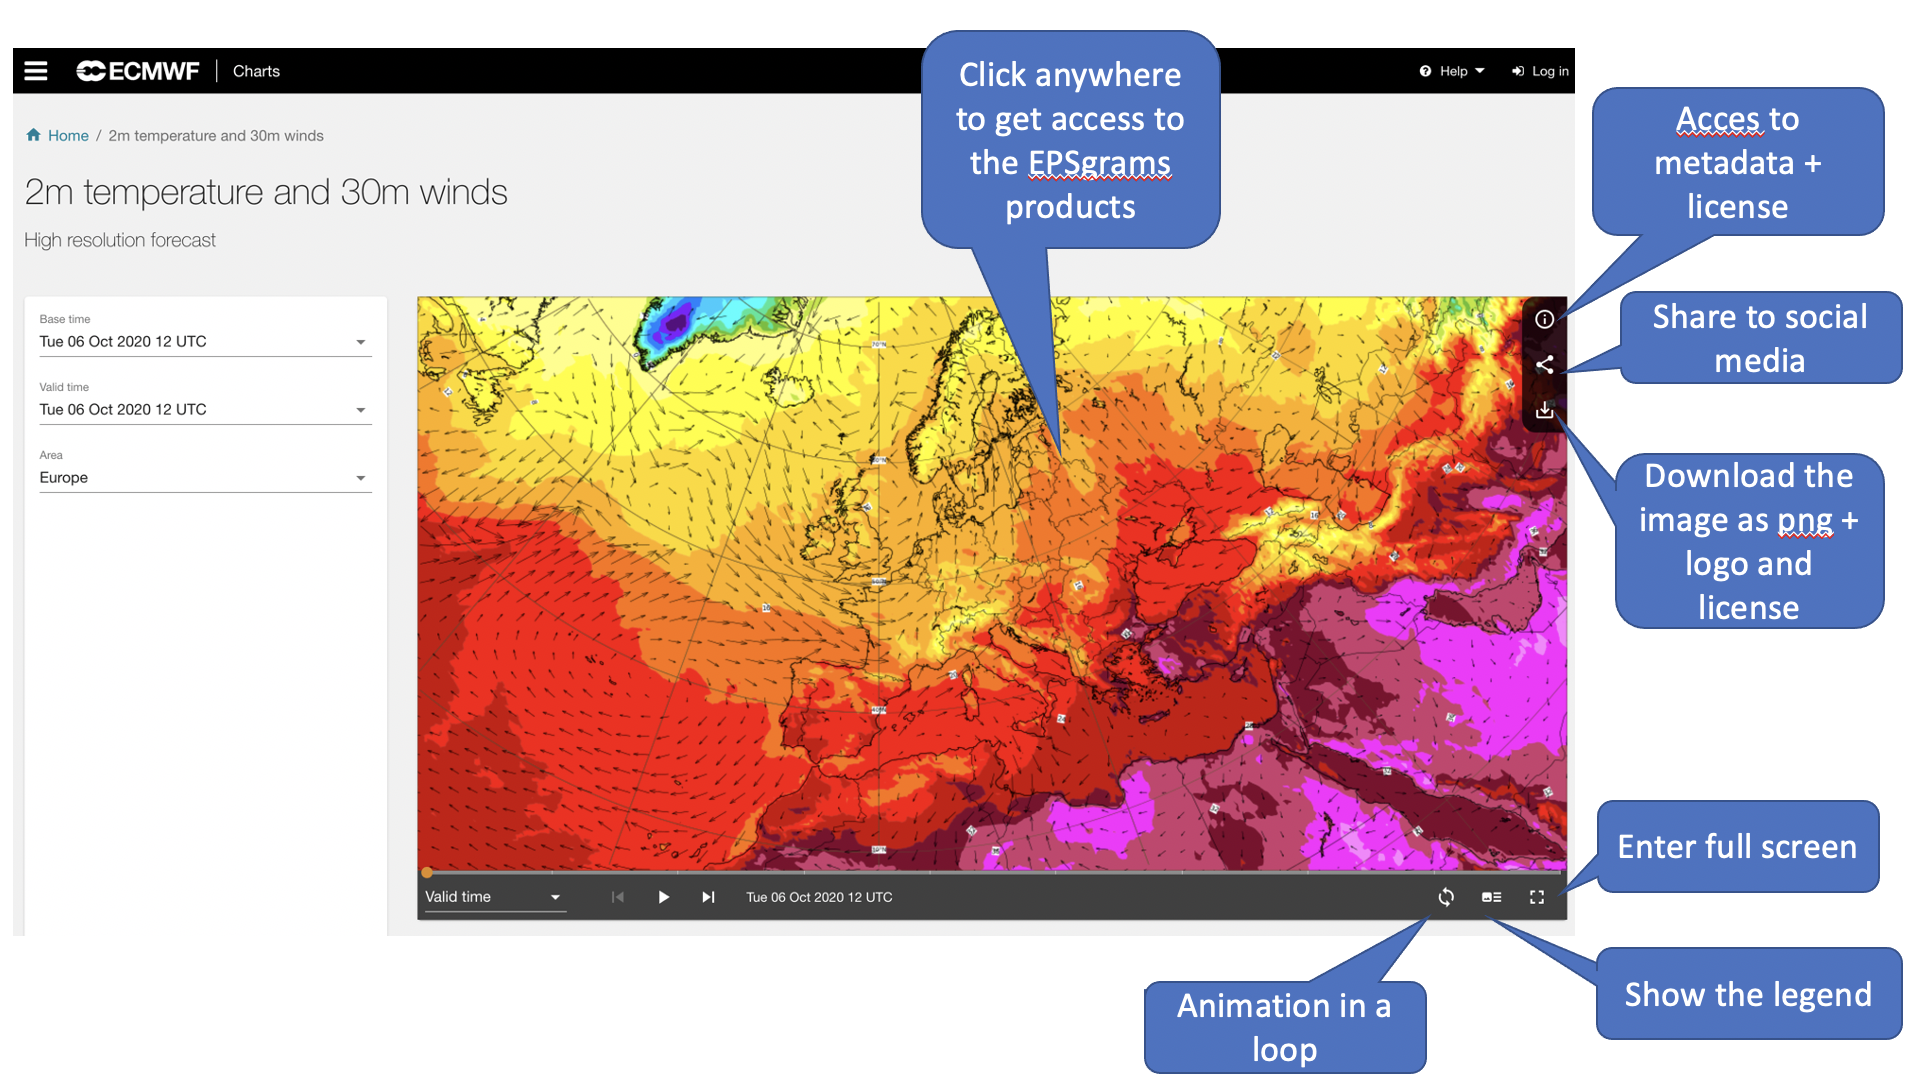
The application is quite similar to the old one, the new thing is the ability to share on social media.
On the forecast, you can click anywhere to access the ENSgrams products on that point.
The next steps are to phase out the old catalogue, and we recommend users start using the new catalogue pages. You have plenty of time to send us your feedback and report any missing functionality.
The ENSgrams products and in addition the vertical profiles have been integrated into the new catalogue and will replace the old ENSgrams application.
They can easily be accessed here.