Status:Finalized Material from: Linus Mohamed, Florian, Ivan
Discussed in the following Daily reports:
http://intra.ecmwf.int/daily/d/dreport/2014/05/08/sc/
http://intra.ecmwf.int/daily/d/dreport/2014/05/09/sc/
http://intra.ecmwf.int/daily/d/dreport/2014/05/12/sc/
http://intra.ecmwf.int/daily/d/dreport/2014/05/13/sc/
http://intra.ecmwf.int/daily/d/dreport/2014/05/14/sc/
http://intra.ecmwf.int/daily/d/dreport/2014/05/15/sc/
http://intra.ecmwf.int/daily/d/dreport/2014/05/16/sc/
http://intra.ecmwf.int/daily/d/dreport/2014/05/19/sc/
1. Impact
Between 13 and16 May 2014, severe rainfall hit south-eastern Europe. The worst affected countries were Serbia and Bosnia - Herzegovina where the rain is said to be the worst for 120 years. More than 80 people have died in land-slides and the flooding following the rain and hundred of thousands were forced to leave their homes. A lot of lifestock died during the flooding. Heavy rainfall and strong winds also affected Austria, Slovakia and other neighbouring countries.The rainfall was caused by a cut-off low over south-eastern Europe. The period running up to the event had been wet and the soil was already saturated before the rain event, where the worst areas got more than 200 mm over 3 days.
On 16 May, the Bosnia - Herzegovina and Serbia requested assistance through the EU Civil Protection Mechanism. Serbia declared a state of emergency on Thur 15 May.
This is a list of new items on the event:
http://www.reuters.com/article/2014/05/15/us-balkans-flood-idUSBREA4E0PA20140515
http://www.bbc.co.uk/news/world-europe-27459184
http://www.bbc.co.uk/news/world-europe-27477593
http://en.wikipedia.org/wiki/2014_Southeast_Europe_floods


The figures above show warnings on Meteoalarm for the 14 and 15 May. Red warnings where issued for rainfall in Serbia, Bosnia - Herzegovina, Austria and Slovakia.
2. Description of the event
The severe event started on 13th May with rain along a cold front and strong westerlies. From 13th throughout 14th May an upper-level low formed together with a deep surface low tracking through Bulgaria. Then the heaviest rain fell in parts of Serbia and Bosnia. At the same time severe thunderstorms developed over Bulgaria and Romania bringing hail and strong winds. A tornado or tornado-like phenomena were reported in western and northern Bulgaria damaging severely some houses. The following day the deep surface low was slowly moving to the NW bringing further heavy rain over Serbia. The upper-level cyclone also moved slightly to the NE. On 16th the the low pressure system staying over the Balkans started dissipating. In its northern fringes heavy rain was reported in Slovakia and Austria. On the 18th May in the northern fringes rainfall continued over Austria, Poland and Slovakia with heavy showers as previous days over the rest of the area within the cyclonic circulation.
The figures below show the analyses of t850 and z500 (00UTC). The rainfall was caused by a cut-off low situated over south-east Europe, bringing moist winds from east, hitting the mountains on Balkan.
z500 and t850 analyses


The month before the event had been wet.The figure below shows the accumulated precipitation in short (12-36h) control forecasts from 1 March to 27 May (black line) inside the box (44-45N,.18-20E, see below). The grey line represents the mean of the model climate for this area. For the second half of April and beginning of May more than 200 mm where accumulated. The rainfall causing the flood then appeared in mid May, and the ground was already saturated in the area.

The figures below show the analysis of soil moisture level 1,2,3 with 3 days apart, starting from 10 May. Here one can see that the ground was very wet already before the rainfall.
Soil moisture level 1,2,3 analysis


Below is the radar sequence from the Romanian Met Service for a part of 14 May, showing the persistent rainfall over Serbia and parts of Romania.

The figures below show the observed precipitation for the 14,15, 16 and 17 May (06-06) and the HRES forecast (day 2-3). The forecast underestimated the precipitation in the worst affected areas.
Observed and forecast precipiation (06-06)


The table below shows the observed precipitation for Loznica (13262, 44.3N, 19.1N), Beograd (13274, 44.9N, 20.3E), Valjevo (13269, 44.2N, 19.5E) and Tuzla (14557, 44.5N, 18.7E). The precipitation is the 24-hour observed at 06UTC. The total for the 5-day period (12 May - 17 May 00UTC) was for Loznica 219 mm, Beograd 190 mm, Valjevo 199 mm and Tuzla 249 mm., where the main part fell between 13 May 06UTC and 16 May 06UTC.
| Loznica | Beograd | Valjevo | Tuzla | |
|---|---|---|---|---|
| 13 May | 0 | 0 | 6 | 0 |
| 14 May | 50 | 21 | 38 | 49 |
| 15 May | 110 | 108 | 108 | 95 |
| 16 May | 53 | 45 | 44 | 90 |
| 17 May | 6 | 16 | 3 | 15 |
| 18 May | 0 | 0 | 3 | 0 |
The map below shows the SYNOP stations in the area, with the 4 stations above in a circles. The rektangular area marked in the figure is 44-45N, 18-20E, which will be used in the evaluation below.

The figure below (top, left) shows the 5-day accumulation (13-18 May 00UTC). For the climatology of 5-day accumulations (bottom, left) unfortunately no station appears over Serbia but I found some stations in Austria, Slovakia, Poland and Romania where 5-day totals exceeded 99th percentiles of the 15-year observed climate. On the plot below you can see two examples.

The connection to the cyclone, high wind gusts where measured, especially in the Slovakian mountains with wind gusts of more than 40 m/s. The plot below shows the maximum observed wind gusts for the 15 May.

3. Predictability
3.1 Data assimilation
3.2 HRES
The plots below show z500 and t850 forecasts from HRES, all valid at 00UTC on 15 May. The first plot is the analysis. The large-scale cut-off low was very well predicted.
z500 and t850 HRES forecasts (all valid 15 May 00UTC)


The next plots show the same forecasts but for MSLP and precipitation.
MSLP and precipiation HRES (all valid 15 May 00UTC)


As seen in the previous section, the precipitation in the worst affected areas seems to have been underestimated. The figures below show the precipitation verification for 14 May 06UTC - 15 May 06UTC for forecast from 12, 13 and 14 may 00UTC. Only the very last forecast captured the observed rainfall amounts reasonable.


The figures below show the precipitation verification for 15 May 06UTC - 16 May 06UTC for forecast from 13, 14 and 15 may 00UTC. Here the extreme precipitation over the orography in Austria and Slovakia was underestimated.

The plots below show the accumulated precipitation 12 May 06UTC to 17 May 06UTC for forecast with different resolutions (T1279, T639 and T319) initialised 12 May 00UTC. For this forecast it is a clear difference between the resolutions.


The next figure shows the 3-day accumulated precipitation in the box 44N-45N, 18E-20E from different initial dates (from different resolutions). In the deterministic forecasts a hint of the extreme rainfall started to appear on 6 May. The T319 forecast was very consistent from 6 May 12UTC (probably with a large portion of change). We do not yet have any good gridded precipitation data set, but from the synop stations in the area the observed precipitation for the period should be 170-200 mm.
3.3 ENS
On 14th May in Serbia and Bosnia heavy rain between 40 and 130 mm just in 24h was recorded. From the few stations in Serbia displayed on the plot below we can see that 24-hour accumulations exceeded the 99th percentile of the observed 15-year climate. The most extreme precipitation was observed in Loznica, a station in western Serbia at the border with Bosnia where 129 mm were recorded on 14th May whilst the climate maximum is just 68.4 mm. Comparing the forecast with observations we can notice that 7-days in advance the tail of the forecast consistently predicted extreme values of the rainfall but the forecast was uncertain and therefore EFI values were positive but not high whilst SOT was positive indicating a possibility of an extreme event. Approaching the day of interest forecast CDFs became more extreme ending up with really extreme CDF in the most recent forecast on the day of the extreme rainfall. We can also notice that the forecast underestimated the rainfall totals even for the most extreme members but at the same time such an extreme rain as observed in Loznica seem localized. All the other stations around measured rainfall amounts between 40 mm and just above 100 mm which is close to the rainfall in the most extreme ensemble members.

EFI 5-day (12-17 May)


The plots above show the EFI for a 5-day period (12-17 May for all but the last plot where the period is shifted 1 day). The signal is present already from the longest forecast presented here (from 8 May) and gets stronger as the event approaches.
EFI for 14 May


The plots above show the EFI for 14 May (the day with the heaviest precipitation in Serbia) from different initial times.
3.4 Monthly forecasts
The figure below show the analysis of weekly precipitation anomalies for 12-18 May and all Thursday forecasts.

The figures below show the 3 last monthly forecasts (12, 8 and 5 May). The earliest monthly forecast that got a signal was 8 May. Note that the event was covered by the 15-day ensemble for that initial date.
Weekly precipitation anomalies


3.5 Comparison with other centres
The plots below show the accumulated precipitation 12 May 06UTC to 17 May 06UTC for forecast (control) from different centre (ECMWF, UKMO, NCEP and CMC) initialised 12 May 00UTC. Most rain was produced by UKMO and CMC. Note that NCEP clearly underestimated the precipitation for this initial time.


The figure below shows the 3-day accumulated precipitation in the box 44N-45N, 18E-20E from different initial dates (for control forecasts from different centres). In general UKMO seems to be able to produce most rain for the region.

The figure below shows the evolution of probabilities for >60 mm for the 3-day period 13 May to 16 May for the box 44-55N, 18-20E for ensemble forecasts from different initial dates (x-axis). We have to bear in mind here that one cannot evaluate a probabilistic forecast for one event, but the plot gives an indication of the strength of the signal. For the shortest forecasts, UKMO has the strongest signal, as expected from the CDF above. This could be due to a wet bias in their model, but it has to be evaluated further. NCEP had the bad forecast for 12 May 00UTC, which is also present in the ensemble.
ECMWF started to pick up a signal on 6 May together with UKMO. UKMO had a drop in the probabilities the day after, connected to a bad forecast on the European scale. One thing worth to mention is that all but one ECMWF HRES, control and T319 forecasts (as seen in HRES section) had the event from 8 May 00UTC and onwards (total 30 forecasts, 97% probability), but the ensemble probabilities for all but the last ensemble (13 May 00UTC) had probabilities below 80%. It could be interesting to investigate if it could be diagnosed further.

The plots below show the CDFs for the TIGGE forecasts from the plots above (3-day precipitation for the area).
3-day precipitation for area


The plot below shows the CDF for 14 May 06UTC to 15 May 06UTC for Beograd (left 108 mm observed) and Loznica (right, 110 mm observed). On this short lead time only NCEP got high precipitation amounts for Beograd, while UKMO had a bad forecast (due to model spin-up or something else?). For Loznica CMC had the worst performance, while the other three centres were very similar.


To conclude, the results are quite mixed comparing different centres. The outstanding results are the high precipitation for 3-days accumulation from UKMO, which could be related to the general frequency bias towards wet events (see http://intra.ecmwf.int/plots/d/inspect/_mo8_precip_inter/precip_inter/etspssfb!FB!Europe!10mm/24h!FMA_2014!12UTC!/ ). ECMWF seems to have picked up the signal one day before the other centres.
3.6 EFAS
EFAS
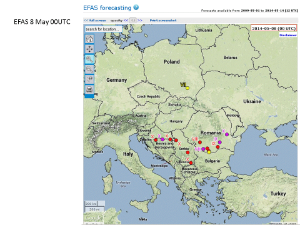


The figures above show the sites where the alert levels are reached in the EFAS forecasts for different initial date of the forecasts. The colour of the circles corresponds to different return periods (purple>20 years). Already on the 8 May several stations had a high level forecasted and the signal got persistent from the 10 May.


The figures above show the modelled flow for river Sava, close to Beograd. The peak flow appear around 18-19 May, with a flow of 6500-7000 m3/s in the EFAS system (corresponding to ~500 years return period). Already the longest forecast covering this date (9 May) had a number of ensemble members with return period >20 years. After the rain fell 14-15 May the uncertainty got minimal (as the flood model for the initial conditions is driven by observed precipitation). The hydrological part of the event is described on http://hepex.irstea.fr/balkans-worst-floods-for-more-than-100-years/
4. Experience from general performance/other cases
- The flooding in central Europe 2013. Technical Memorandum can be found here. This case agrees about the underestimation of the extreme precipitation and the dependence of resolution.
5. Good and bad aspects of the forecasts for the event
- Good early detection of the large scale cut-off low and extreme precipitation (in EFI)
- Early response in the EFAS system
- Precipitation amounts clearly underestimated
- Only the very last forecast captured the amount
6. Additional material
Information sheet from JRC/EFAS 16 May
Analysis of the event by NOAA.
Discussion in Daily Report about the calculation of EFI (http://intra.ecmwf.int/daily/d/dreport/2014/05/20/sc/)
FD/RD presentation from Fernando about the weeks before the main event