Status:Ongoing analysis Material from: Linus
Discussed in the following Daily reports:
Picture
1. Impact
On Saturday 12 September southern France was hit but flash floods and the day after Genoa in north-western Italy was hit. 2 people were killed in the Emilia Romagna region. On 14 September a strong convective cell affected Veneto (NE Italy) and created hailstones in size of tennis balls.
2. Description of the event
The plots below shows MSLP and 12-hour precipitation from short forecasts.
MSLP and 12-hour precipitation (short forecast)
There are no images attached to this page.
From Federico Grazzini:
"
After the rainfall 13 September over north-western Italy widespread flash flood has been observed on the western part of the Apennines and historical discharges was recorded on the Nure, and Ceno streams, and also on the Trebbia river that is the largest river of Emilia-Romagna region. Thinking that the Trebbia river (the river is very large, could reach a maximum discharge of 2500 m3/s) has broken the previous historical records by several meters is giving the measure of the amount and intensity of the rain.
The incredible thing is that the precipitation has been generated by a single MCS, classifiable as "V-shape", that formed upstream the Apennines in a warm and humid south-westerly blowing from the Gulf of Genova. It started ad 18 UTC and it lasted approximately up to 6 UTC, just changing shape and moving a little bit, but substantially remained almost stationary. See the picture below taken at 00UTC 14/09/2015. This has generated more than 300mm, recorded by many stations on the upper part of those basins. The precipitation intensity was also striking with 4 stations recording more than 110mm per hour and almost 10 stations recording more than 80 mm per hour. See the map of the total precipitation fallen during the event between 13 and 14/09 over the station network of Emilia-Romagna
Saturday (12 Sept 06- 13 Sept 06z)
Sunday (13 Sept 06z - 14 Sept 06z)


Monday (14 Sept 06z - 15 Sept 06z)

3. Predictability
3.1 Data assimilation
3.2 HRES
Saturday (12 Sept 06- 13 Sept 06z)
The plots below show forecasts from 12 Sept 00z, 11 Sept 12z ans 11 Sept 00z.


Sunday (13 Sept 06z - 14 Sept 06z)
The plots below show forecasts from 13 Sept 00z, 12 Sept 12z ans 12 Sept 00z.


3.3 ENS
Saturday 12 Sept
EFI and SOT for precipitation (from 12 Sept 00z and 11 Sept 00z)

Sunday 13 Sept
EFI and SOT for precipitation (from 13 Sept 00z, 12 Sept 00z and 11 Sept 00z)


Monday 14 Sept
EFI and SOT for precipitation (from 14 Sept 00z, 13 Sept 00z and 12 Sept 00z)


EFI and SOT for CAPE+SHEAR (from 14 Sept 00z, 13 Sept 00z and 12 Sept 00z)


3.4 Monthly forecasts
3.5 Comparison with other centres
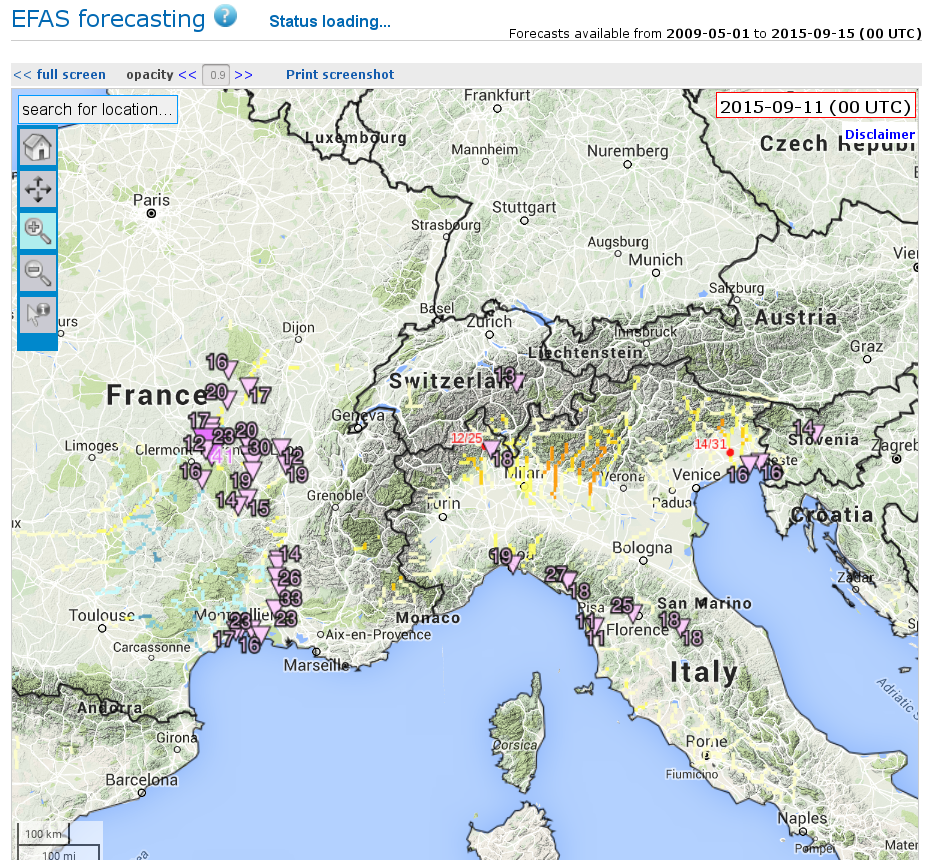
3.6 EFAS
EPIC


ERIC

4. Experience from general performance/other cases