Status: Finalised Material from: Linus, Trond Iversen and Ole Vignes (met.no)
Discussed in the following Daily reports:
http://intra.ecmwf.int/daily/d/dreport/2014/10/28/sc/
http://intra.ecmwf.int/daily/d/dreport/2014/10/29/sc/

1. Impact
In the end of October 2014 heavy rainfall affected south-western Norway and caused the worst flooding in the area for more than hundred years.The worst affected area was inland Bergen and around Voss. In the valley around Flåm many houses fell down in the stream as the river eroded its banks.
Photos and a video showing the effects of the flooding can be found on the Norwegian television homepage: http://www.nrk.no/sognogfjordane/forti-husstandar-i-flam-kan-snart-fa-flytte-heim-1.12015077 (you can find the video if you scroll down)
2. Description of the event
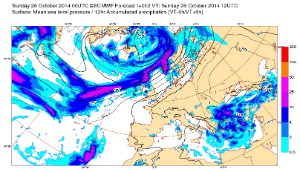
The series of plots below shows short forecasts of MSLP and precipitation starting from 20 October to 29 October. During the whole 9 day period a more or less continuous rainfall affected south-western Norway, caused but a persisting low over Iceland bringing moist air from south-west towards Norway. Scotland was affected by heavy rainfall during the period as well.. The most intense rainfall occured between 26 and 28 October.
12-hour forecasts of MSLP and precipitation


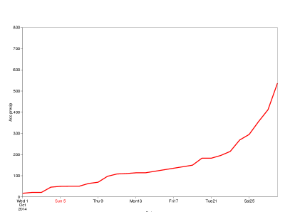
The plots below shows observed accumulated precipitation for the stations Takle (61.03N, 5.28E, left) and Modalen (60.86N, 5.97E, right). The accumulation start 1 October. The normal October rainfall for Takle is 407 mm. The station Modalen was established 2008 and therefore are no normal values available (facts from yr.no). For both stations we see a rapid accumulation since the 22 October.

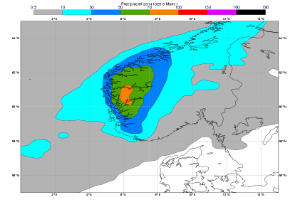
The next plot shows the 3-day accumulated precipitation for the period 26 October 06z to 29 October 06z. Almost all stations north of 60N and west for 8E had more than 100 mm/72h and a few stations measured more than 200 mm.

The plot below shows the red warning for south-western Norway for the 28 October.

3. Predictability
3.1 Data assimilation
3.2 HRES
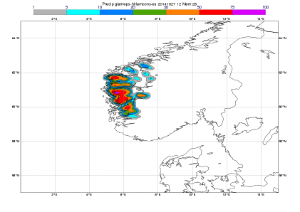
Results focusing on 27 October 18z to 28 October 18z (24-hour)
The plot below shows the observations from the period:

The plots below are for the 24-hour accumulation from HRES (16 km).
HRES (24-hour)


The plots below are for the 24-hour accumulation from ENS control forecast (32 km).
CF (24-hour)


The plots below are for the 24-hour accumulation from NCEP ensemble control forecast (64 km?), retrieved from TIGGE. Interestingly one of the forecasts manged to produce very high precipitation although the low resolution.
NCEP CF (24-hour)


1. 27 Oct 12z
2. 27 Oct 00z
3. 26 Oct 12z
4. 26 Oct 00z


5. 25 Oct 12z
6. 25 Oct 00z
7. 24 Oct 12z
8. 24 Oct 00z

9. 23 Oct 12z
NCEP CF (24-hour) |
|||
|---|---|---|---|
|
|
|
|
|
|
1. 27 Oct 12z
|
2. 27 Oct 00z
|
3. 26 Oct 12z
|
4. 26 Oct 00z
|
|
|
|
|
|
|
5. 25 Oct 12z
|
6. 25 Oct 00z
|
7. 24 Oct 12z
|
8. 24 Oct 00z
|
|
|
|||
|
9. 23 Oct 12z
|
|||
The plots below are for the 24-hour accumulation from DMI ensemble control forecast (5.5 km), retrieved from TIGGE-LAM. Here we start to the orographic features in the precipitation.
DMI Hirlam CF 5.5km (24-hour)


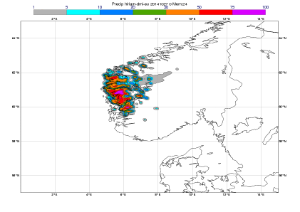
The plot below shows a forecast run initialised 27 Oct 00z with TC1279 (8km) resolution and cycle 41r1. Compared to HRES orographic features are more apparent and the peak in the precipitation matches the maximum from the observations.
cy41r1 TC1279 (8 km) 24-hour precipitation


The plot below shows the 2.8 km AROME model from met.no/SMHI, initialised on the 27 Oct 12z (provided by Lisa Bengtsson, SMHI). Here the details in the topography is event clearer.

The plot below shows the 2.8 km AROME model from met.no/SMHI, initialised on the 27 Oct 00z and accumulated between 27 Oct 18z to 28 Oct 18z (provided by Ole Vignes/met.no).

3.3 ENS
Probabilities >100 mm/24h (27 Oct 18z -28 Oct 18z)
ECMWF >100mm


NCEP >100mm


GLAMEPS >100mm

DMI >100mm

Probabilities >70 mm/24h (27 Oct 18z -28 Oct 18z)
ECMWF >70 mm


NCEP >70mm


GLAMEPS >70mm


DMI >70mm


EFI
The plots below show EFI and SOT for precipitation over the period 26-28 October, from different initial times. Already the forecast from 20 October had increased EFI values for the actual period and the forecast from the 23 October had a very strong signal.
3-day EFI (26-28 October)


3.4 Monthly forecasts
The plots below shows analysis and forecast anomalies for the week 20-26 October.The precipitation anomaly for western Norway was connected to a warm temperature anomaly and a strong westerly flow. The signal of this flow situation was in the monthly forecasts 2-3 weeks in advance.
Weekly anomalies 20-26 October


The plot below shows the precipitation anomaly for 24-30 October from the forecast issued 6 October. The forecast has a wet anomaly for western Norway.

3.5 Comparison with other centres
See section 3.2 and 3.3.
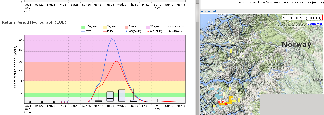
3.6 EFAS
The plots below shows hydrographs (in terms of return periods) for the outflow from Vangsvatnet (60.63N, 628E). The red line is for the ECMWF HRES and the blue for COSMO-EU from DWD (8 km resolution). The COSMO-EU had a much stronger signal than both ECMWF HRES and ENS for this river.
EFAS forecast for Vangsvatnet


4. Experience from general performance/other cases
- Central European flooding in 2013 (ECMWF Technical Memo 723)
- Balkan flooding in 2014 201405 - Rainfall + flood - South-eastern Europe
5. Good and bad aspects of the forecasts for the event
- Early warning from EFI
- Magnitude underestimated but HRES and ENS leading to too weak EFAS forecast
- 41r1 TC1279 performed well, together with high-resolution limited area models (Hirlam, AROME)