...
2. Description of the event
Gallery includeLabel mslp_an sort comment titleinclude 12-hour forecasts of MSLP and precipitation includeLabel mslp_an sort comment
3. Predictability
3.1 Data assimilation
3.2 HRES
3.3 ENS
The series of plots below shows short forecasts of MSLP and precipitation starting from 20 October to 29 October. During the whole 9 day period a more or less continuous rainfall affected south-western Norway. The most intense period was 26-28 October.
Gallery includeLabel efi13 sort comment title 3-day EFI (26-28 October)
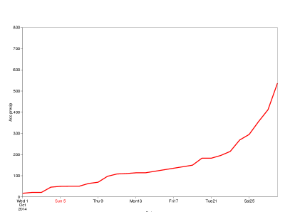
The plots below shows observed accumulated precipitation for the stations Takle (61.03N, 5.28E, left) and Modalen (60.86, 5.97, right). The accumulation start 1 October. The normal October rainfall for Takle is 407 mm. The station Modalen was established 2008 and therefore are no normal values available (facts from yr.no). For both stations we see a rapid accumulation since the 22 October.

The plot below shows the red warning for south-western Norway for the 28 October.

3.4 Monthly forecasts
3.5 Comparison with other centres
...