...
The plot below shows the same as above but for 24-hour maximum wind gusts. (But without AIFS.)
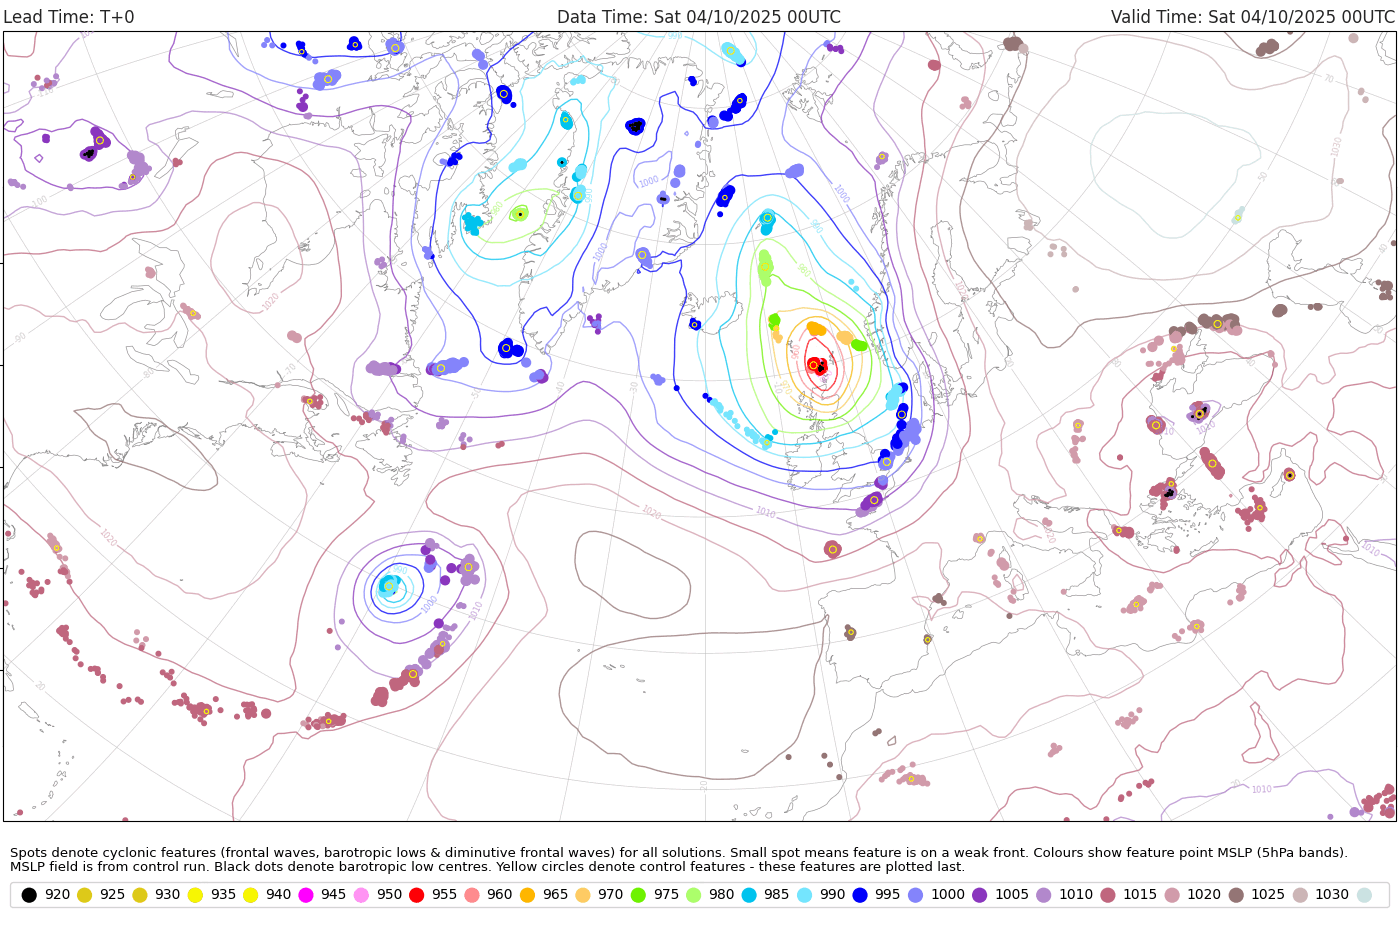
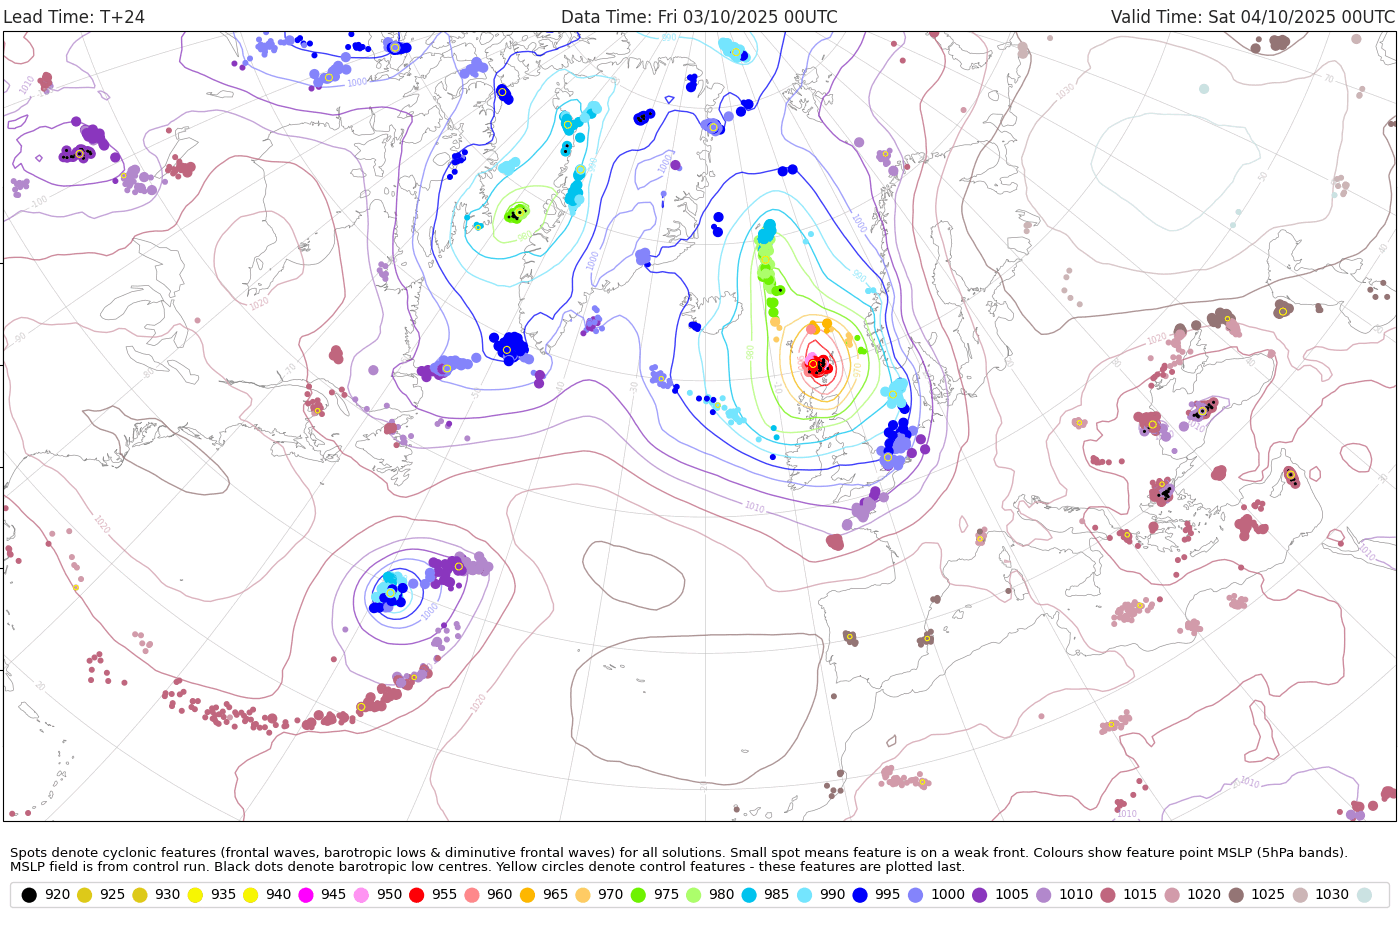
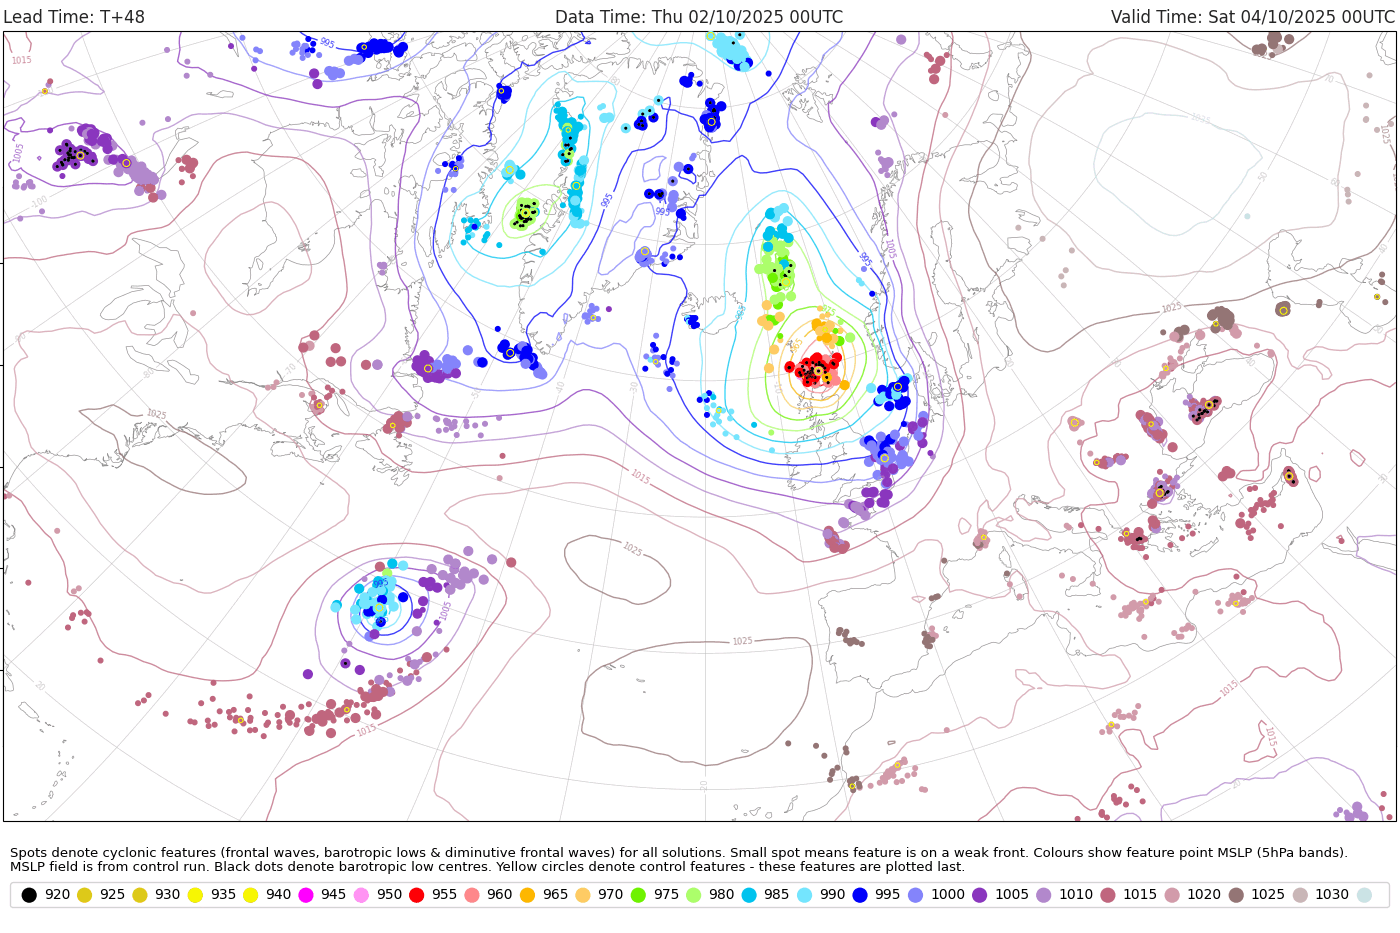
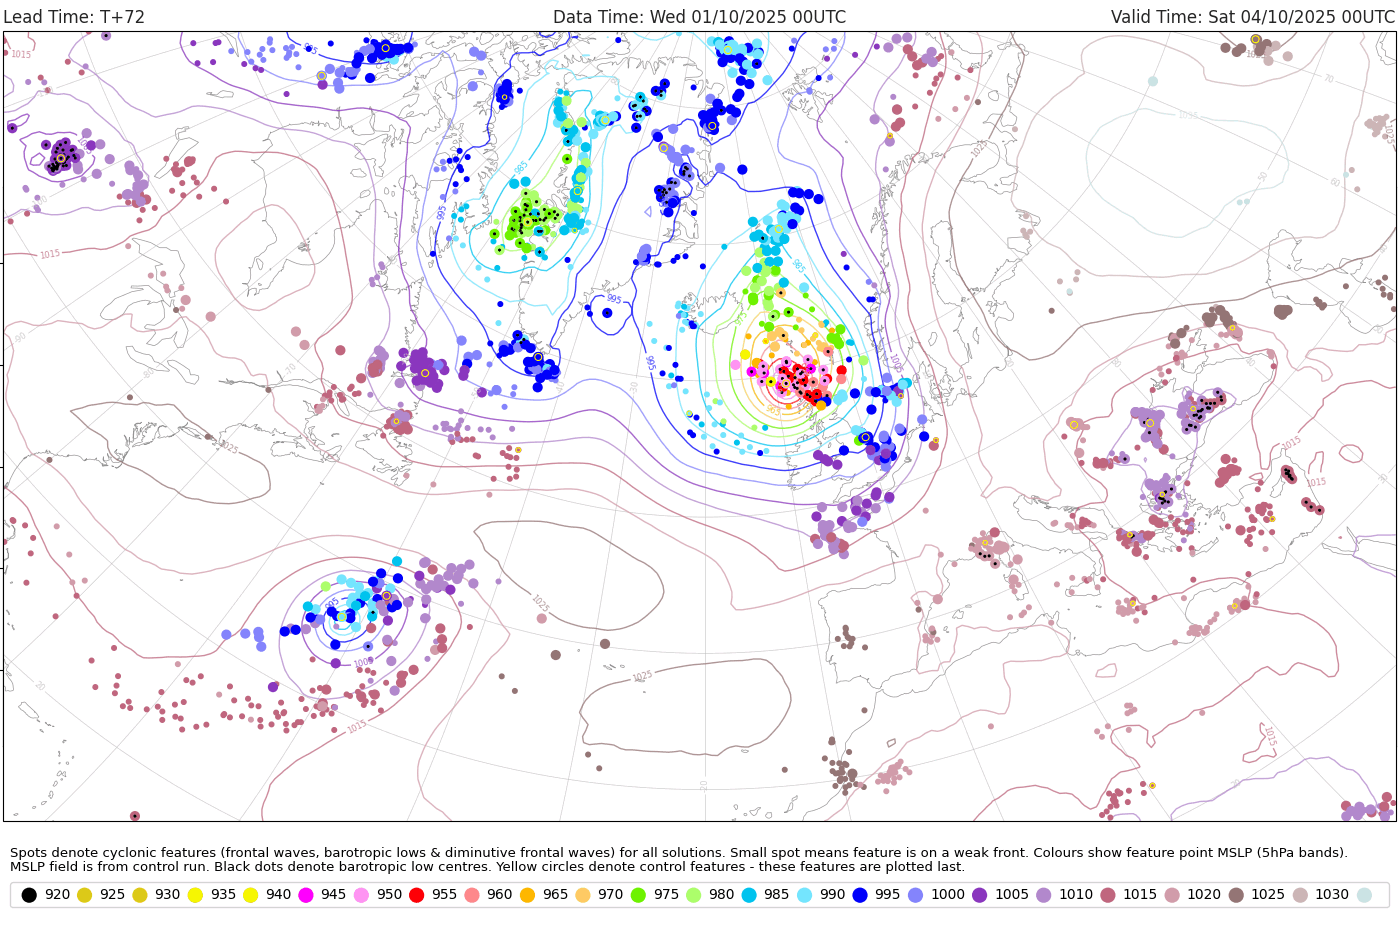
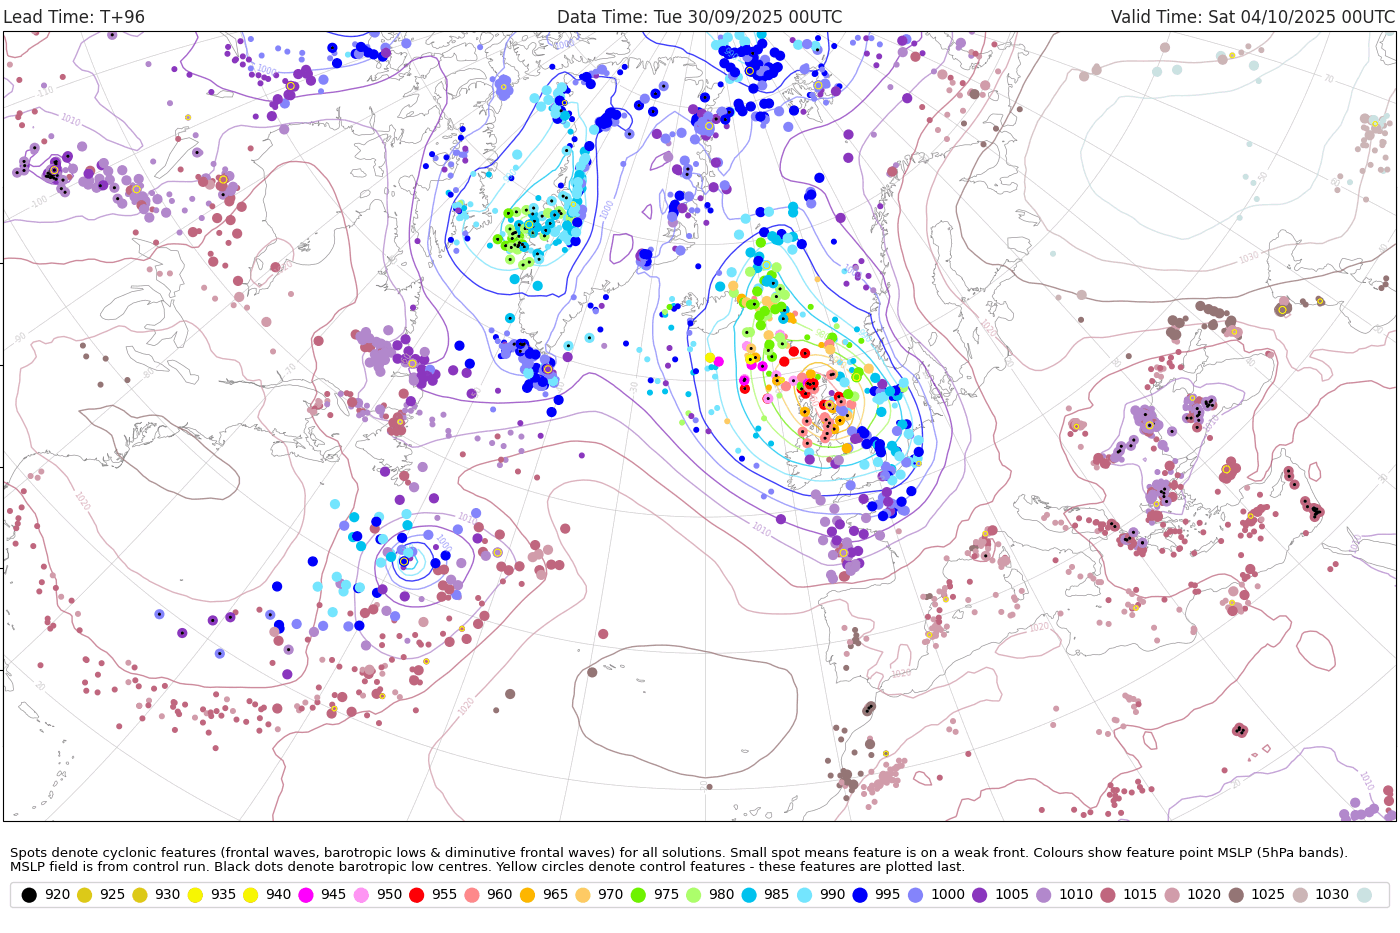
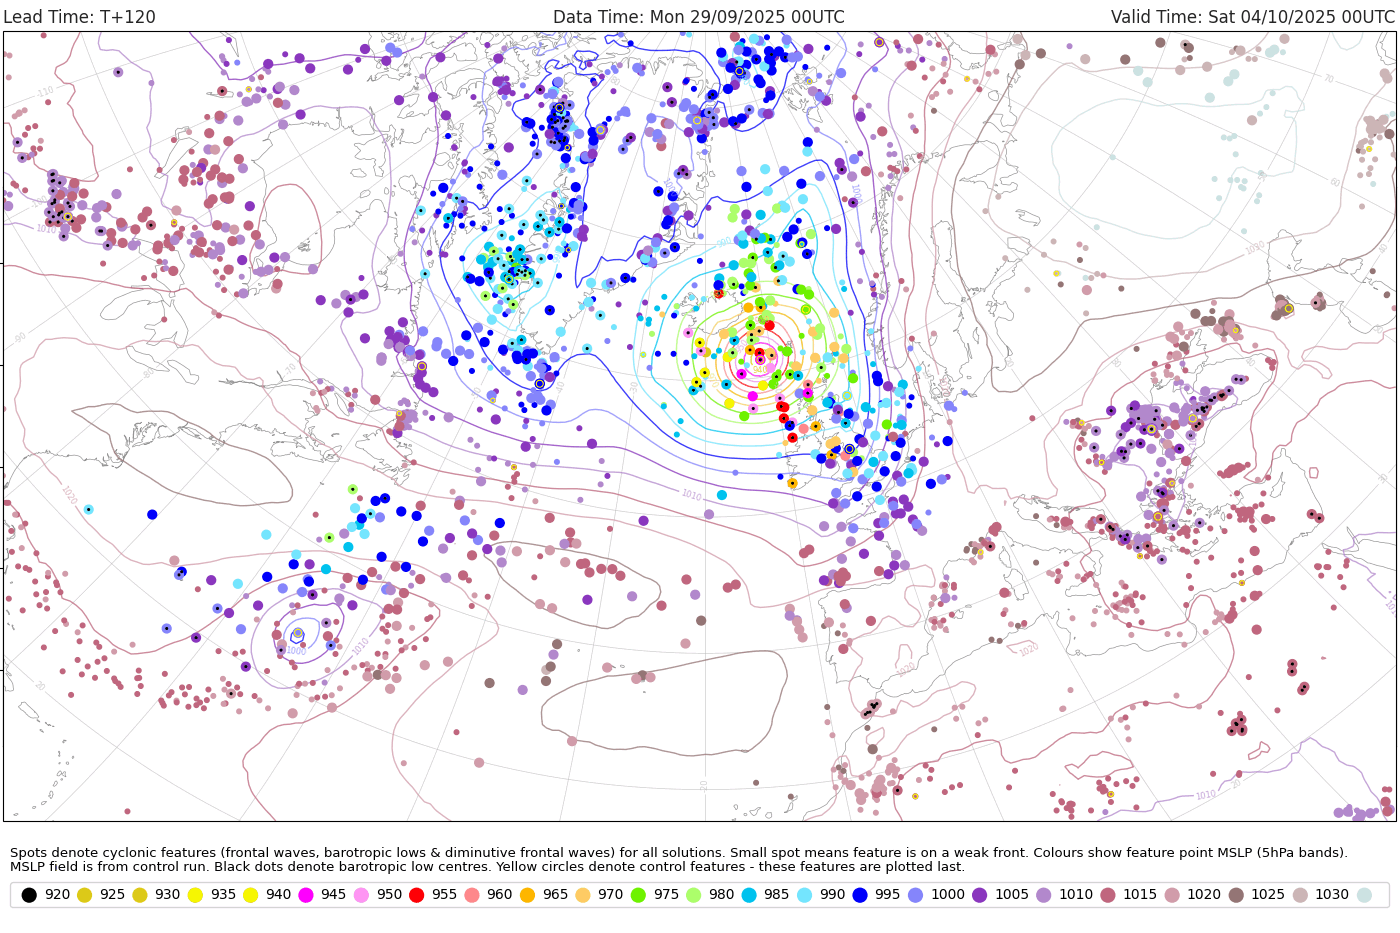
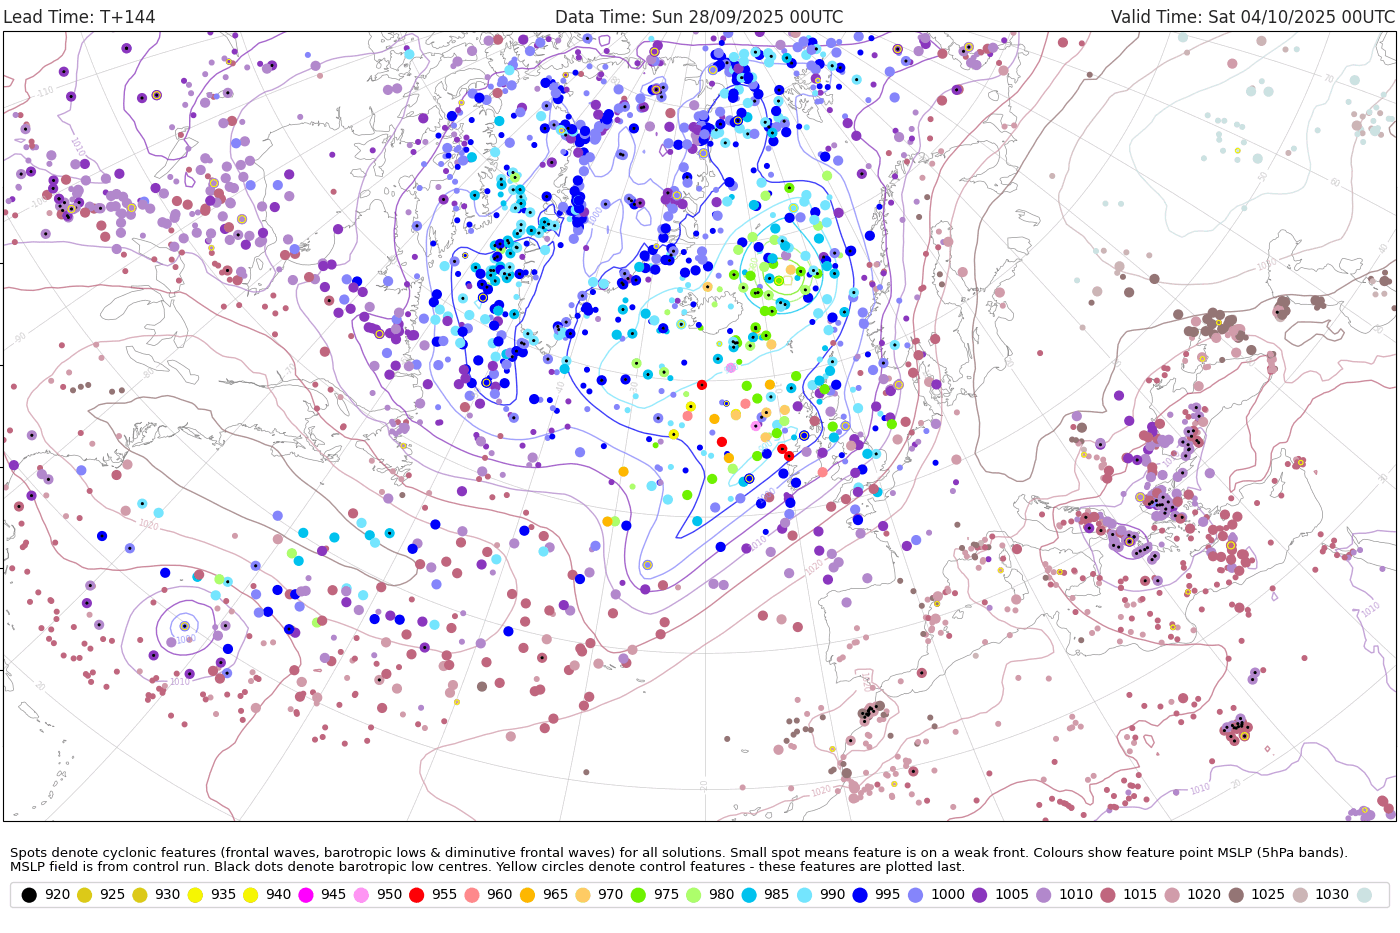
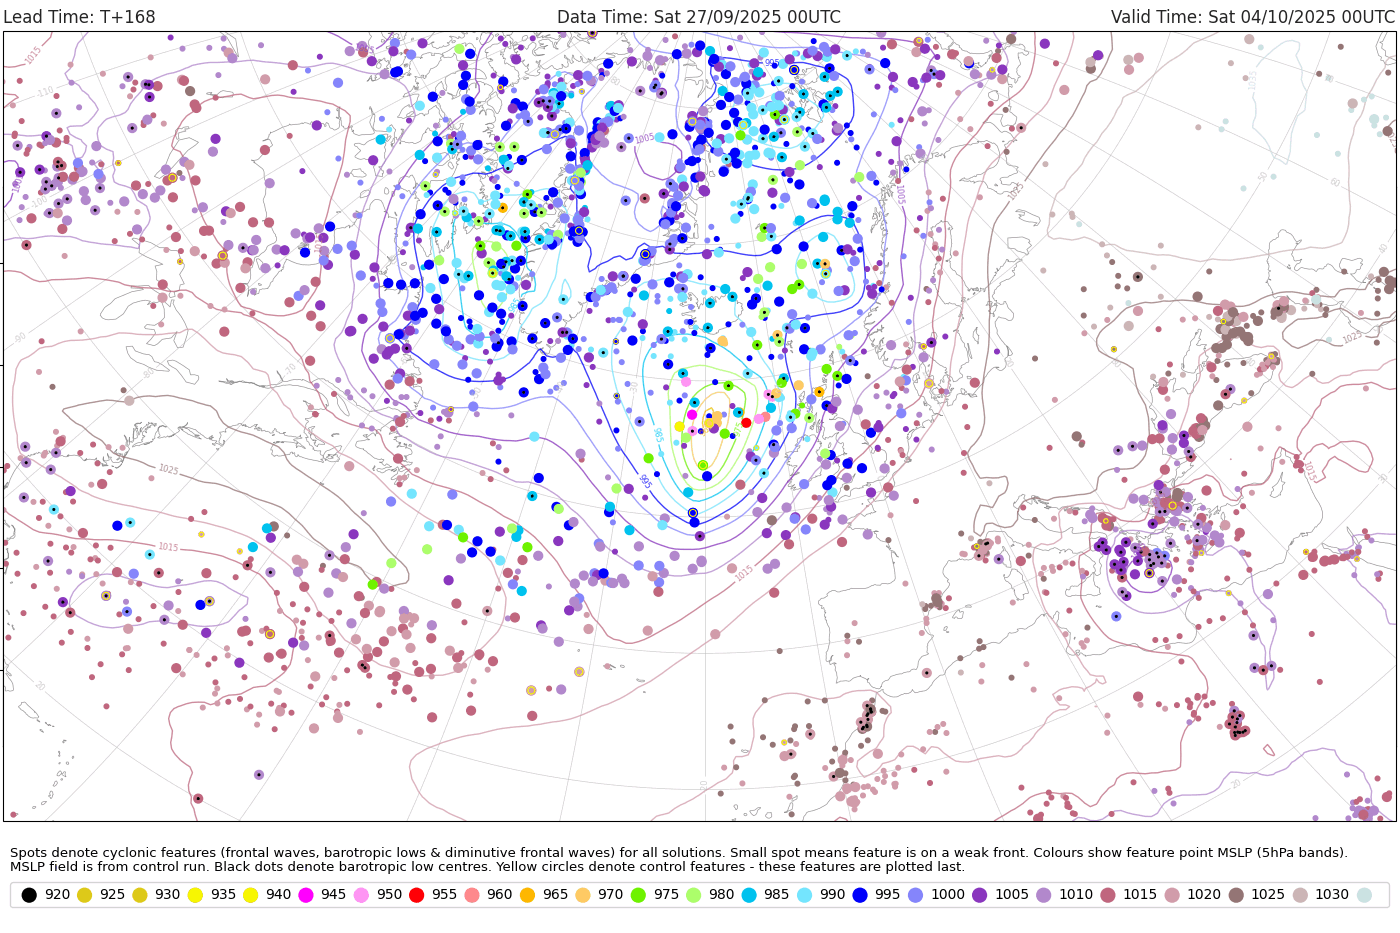
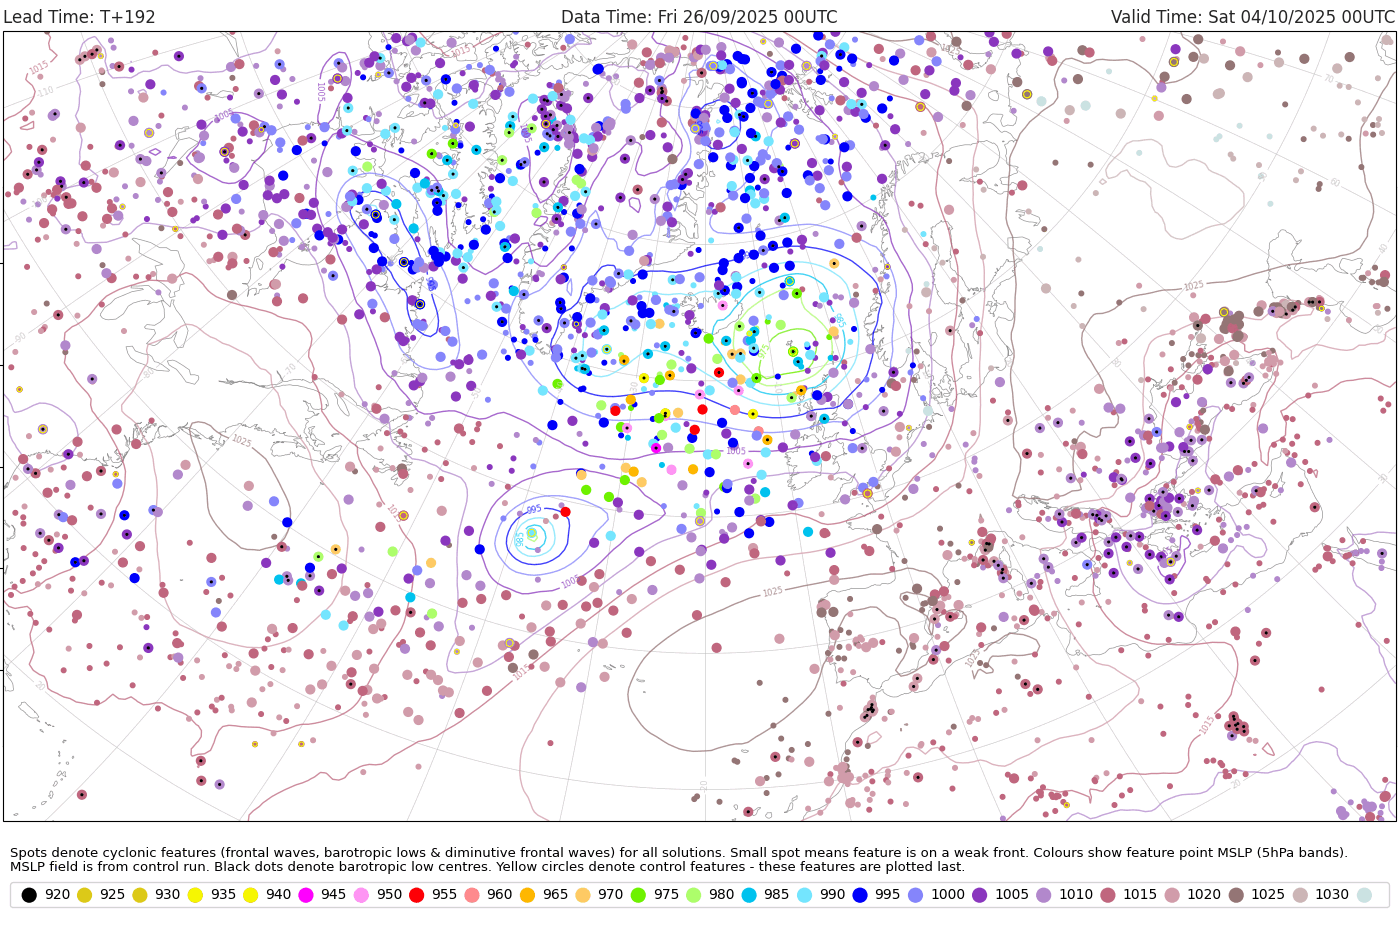
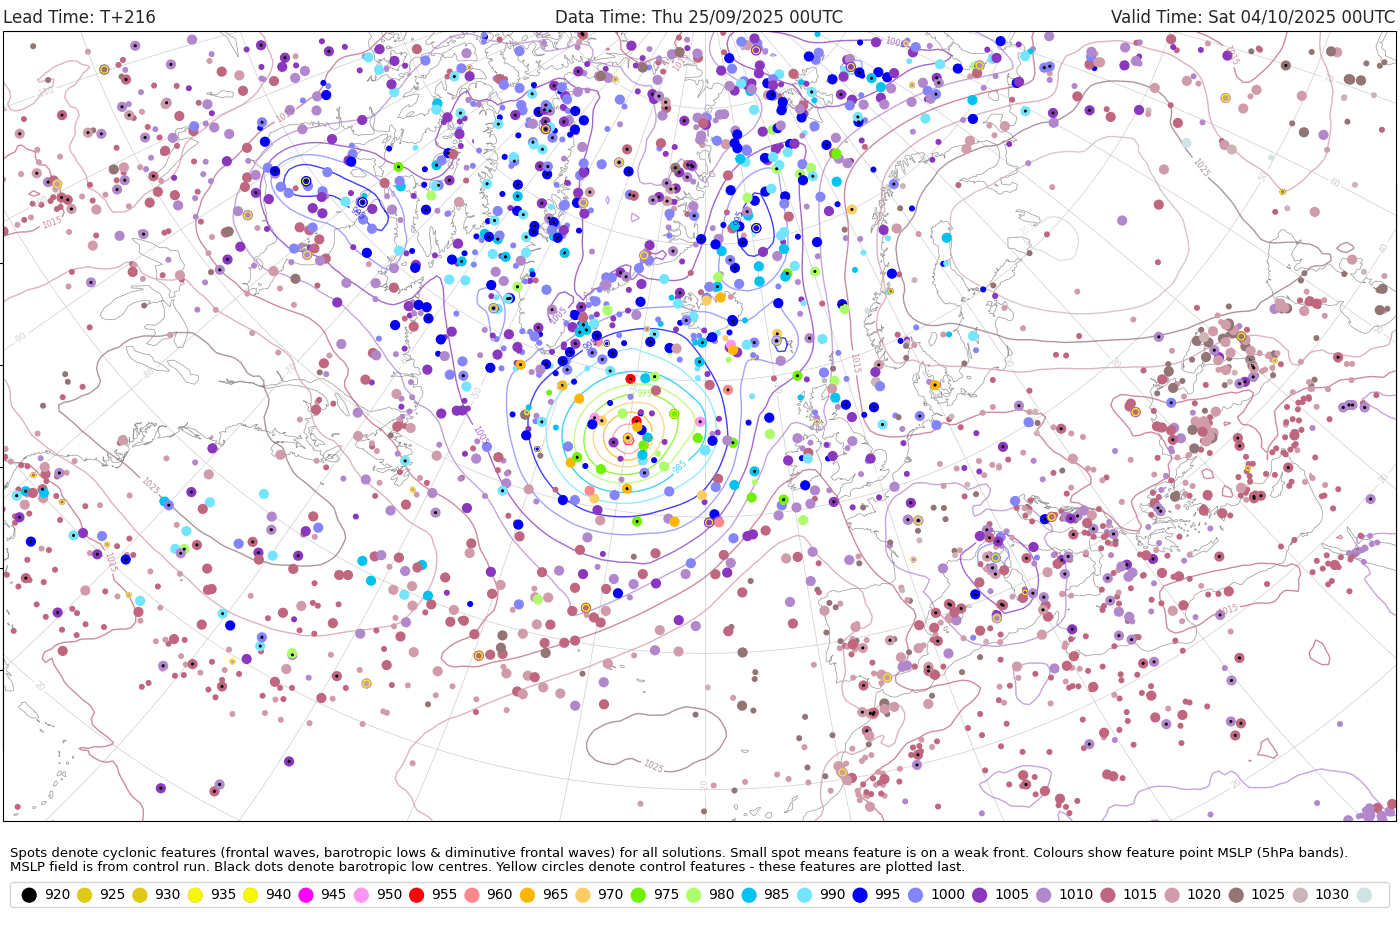
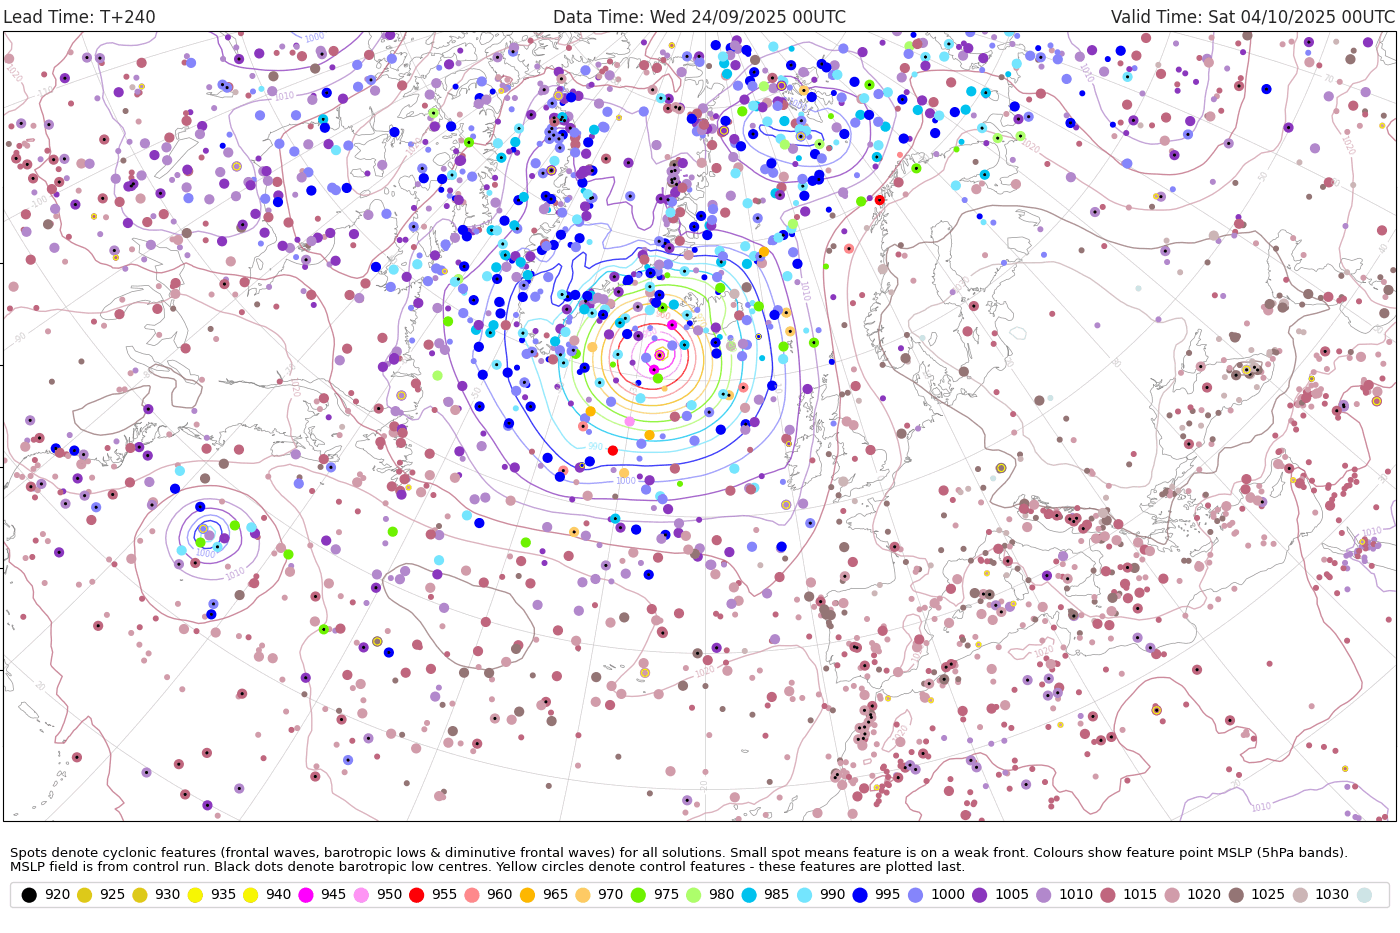
The plots below show the cyclone feature maps valid 4 October 00UTC with the dots coloured by the cyclone minimum pressure.
3.4 Sub-seasonal forecasts
...