Status:Ongoing analysis Material from: Linus, David L.
Picture
1. Impact
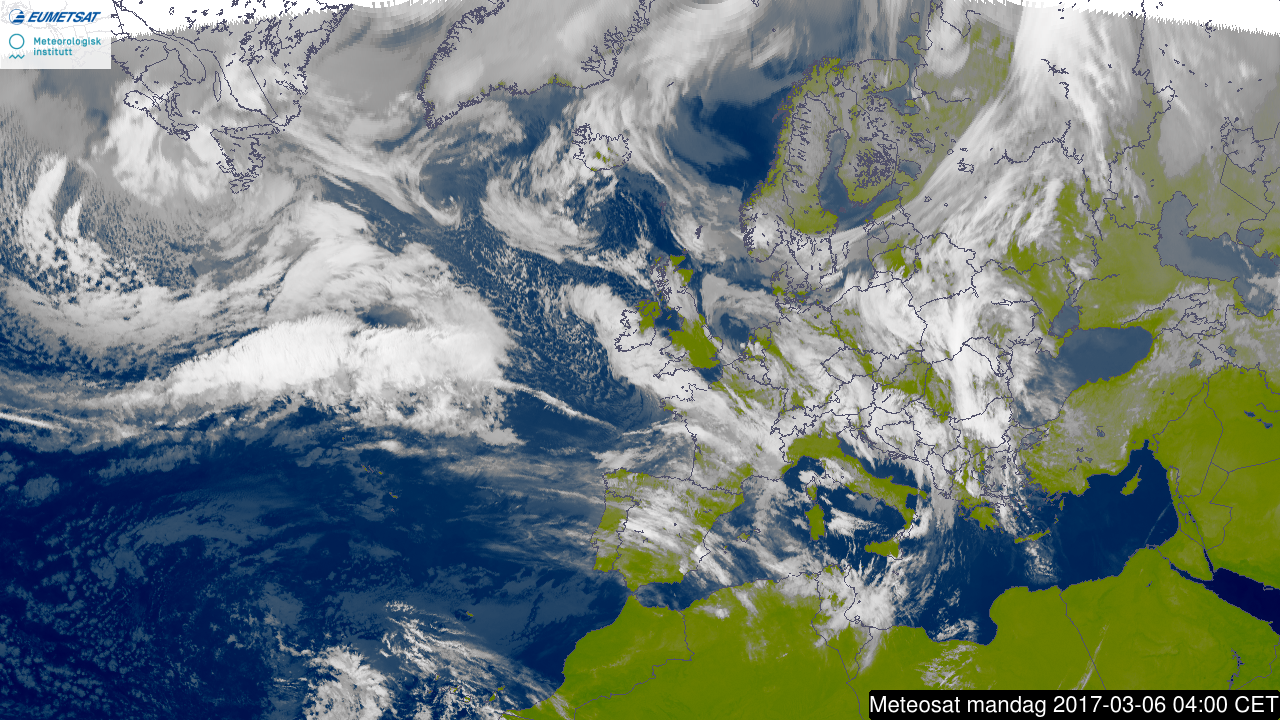
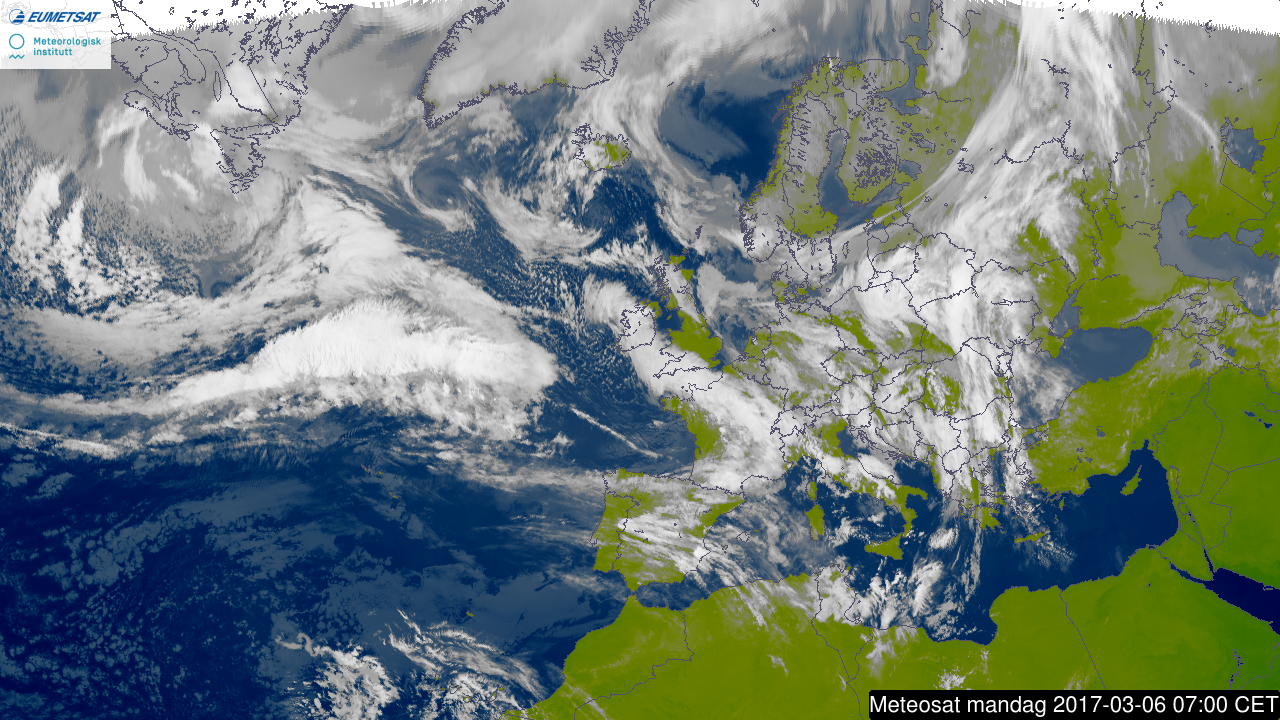
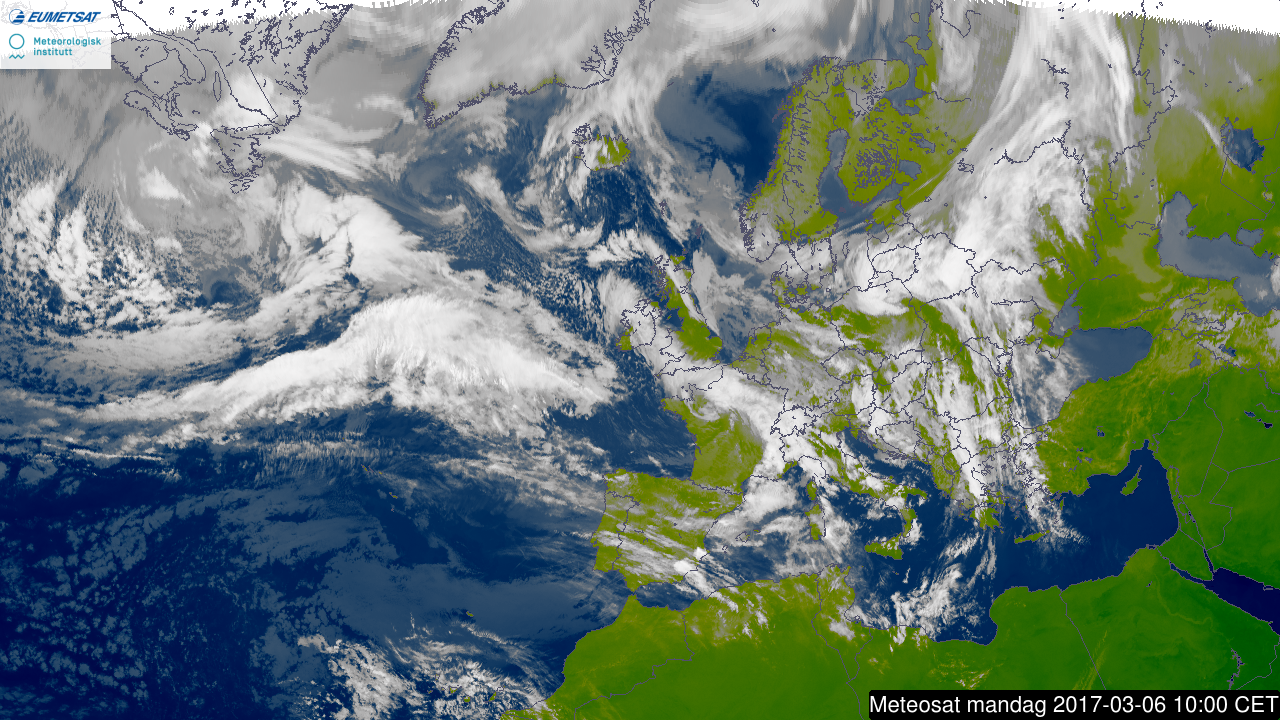
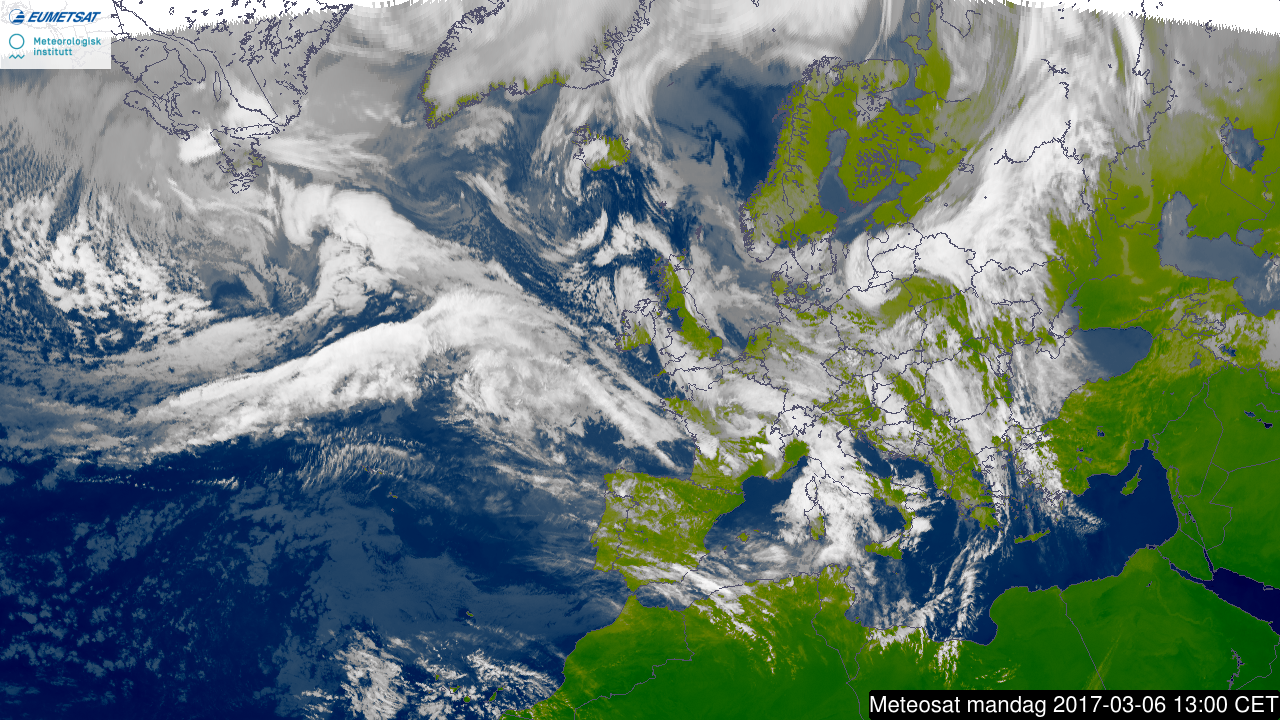
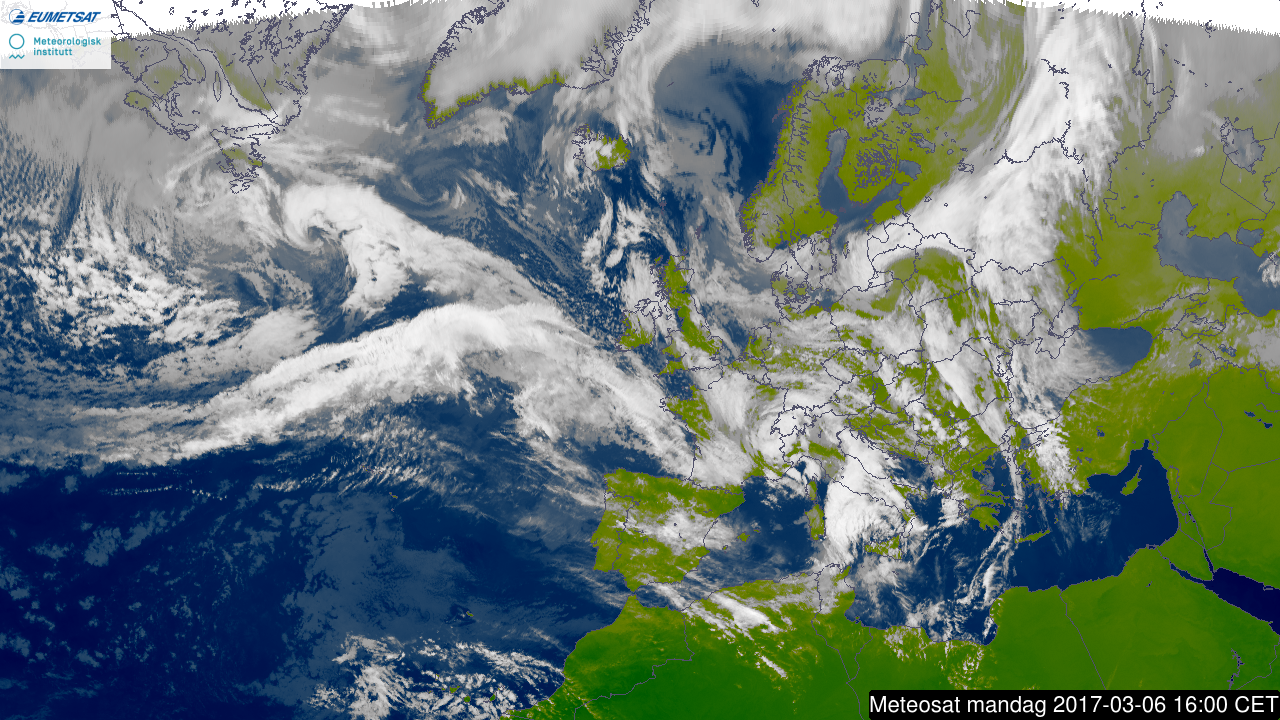
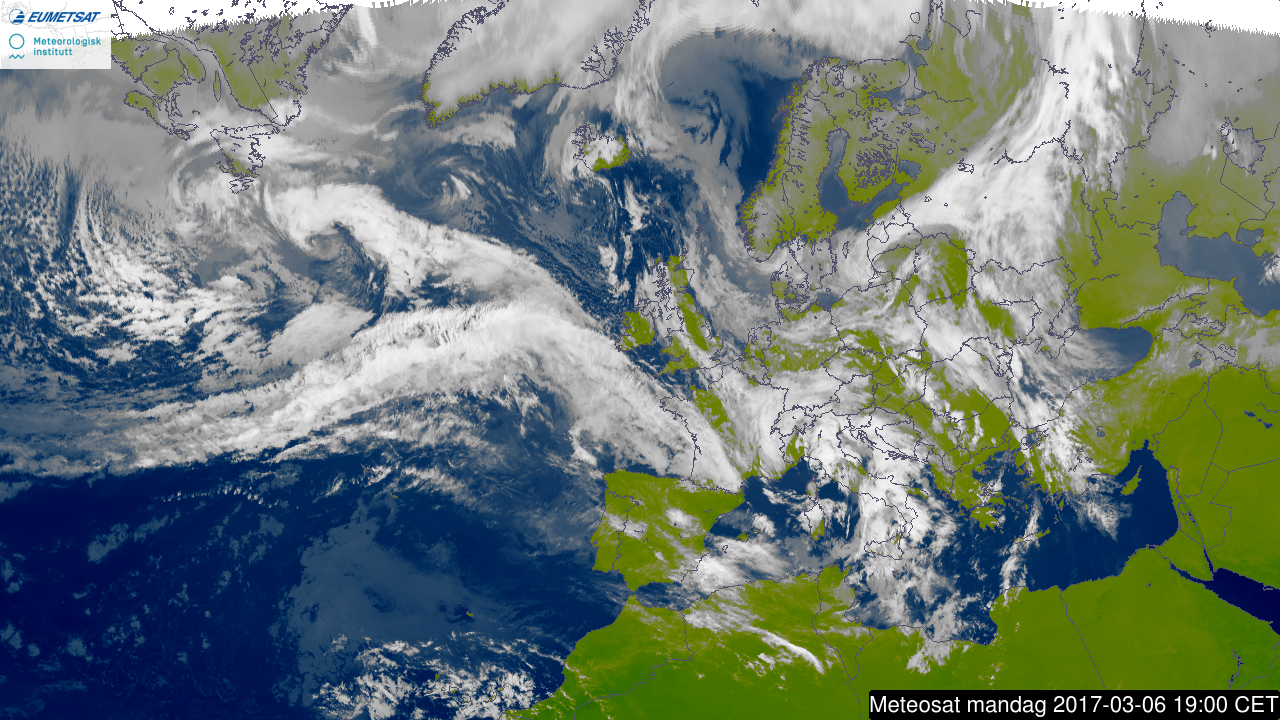
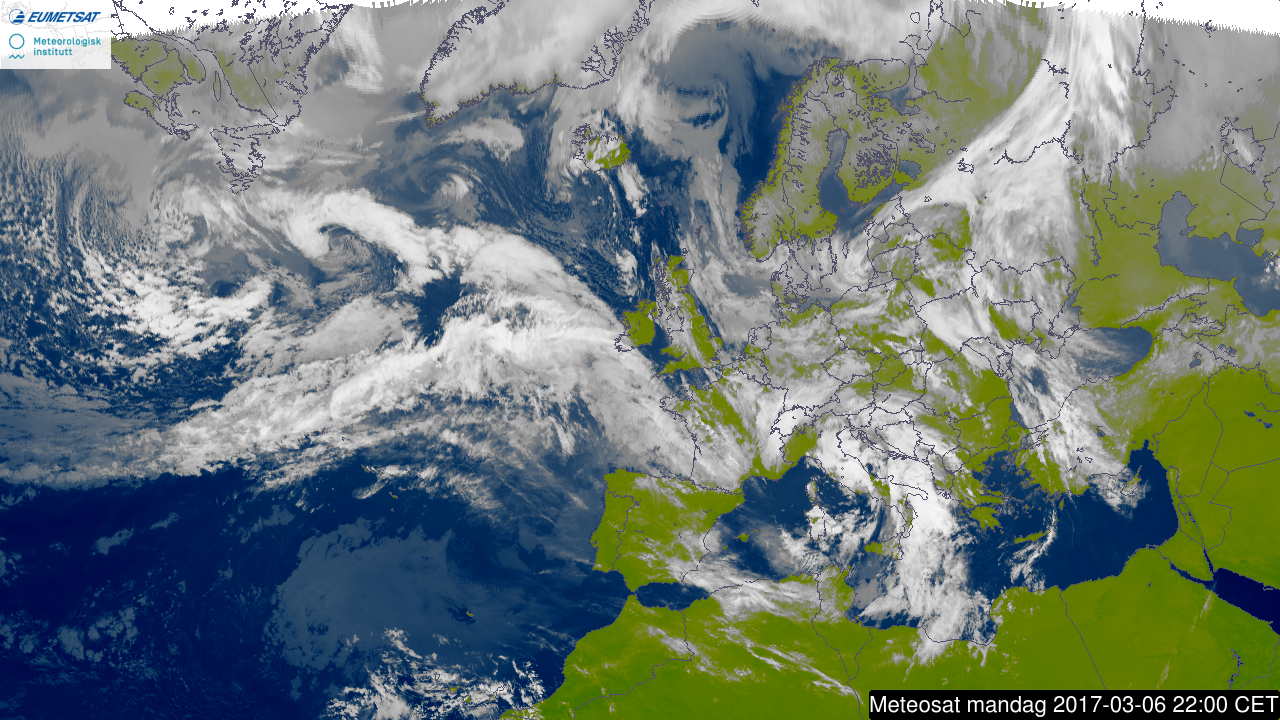
On 6 March large parts of France was hit by the windstorm Zeus.
2. Description of the event
The series of plots below show satellite images from 6 March (every 3rd hour), provided from yr.no.

The plot below show observed 24-hour maximum wind gusts for 6 March.
3. Predictability
3.1 Data assimilation
3.2 HRES
The plots below show 24-hour maximum wind gusts (shade) and MSLP valid 12UTC (contour) for 6 March.

3.3 ENS
The plots below show EFI and SOT for wind gusts valid 6 March (24-hour maximum).

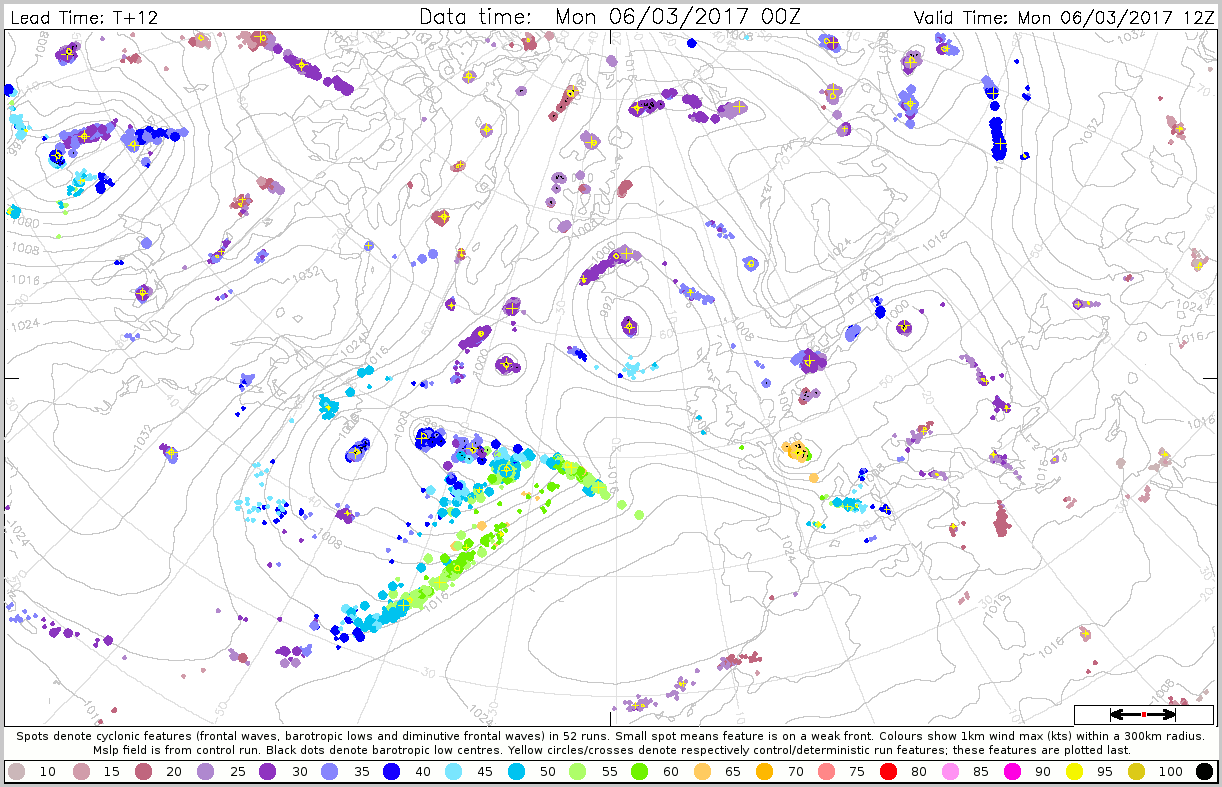
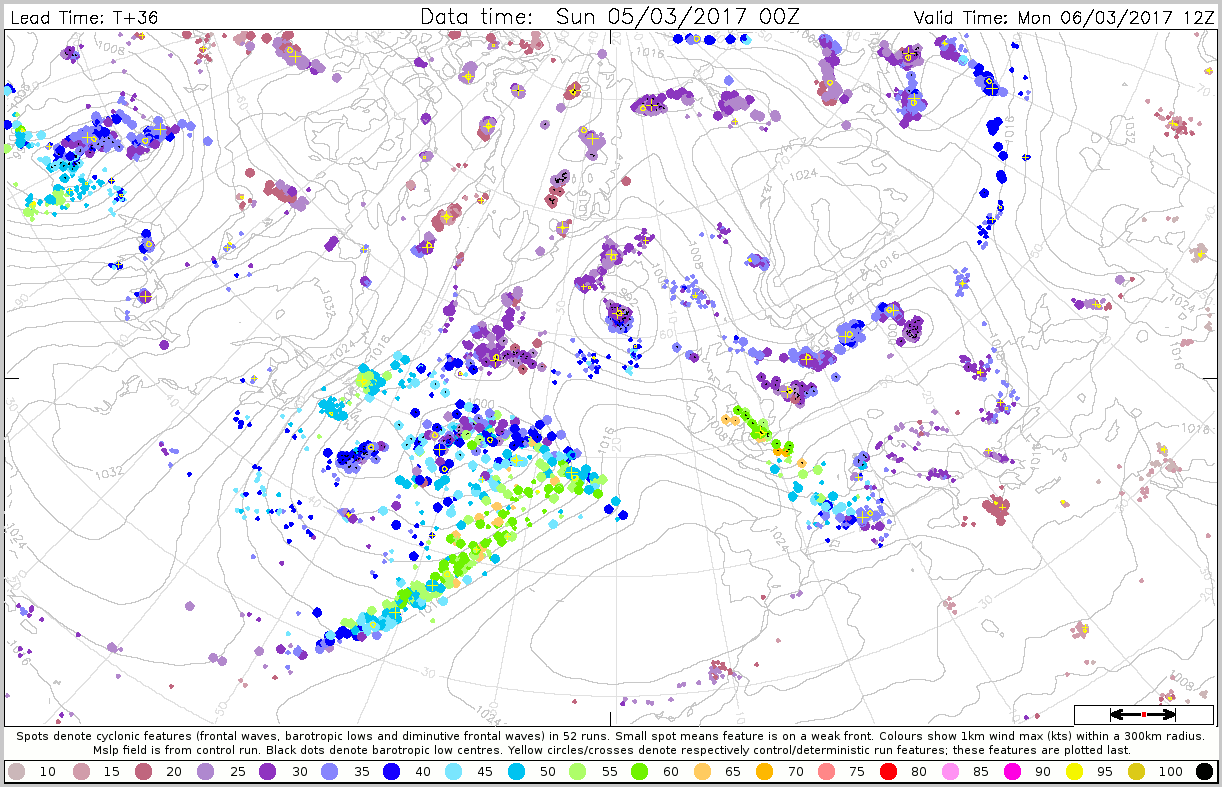
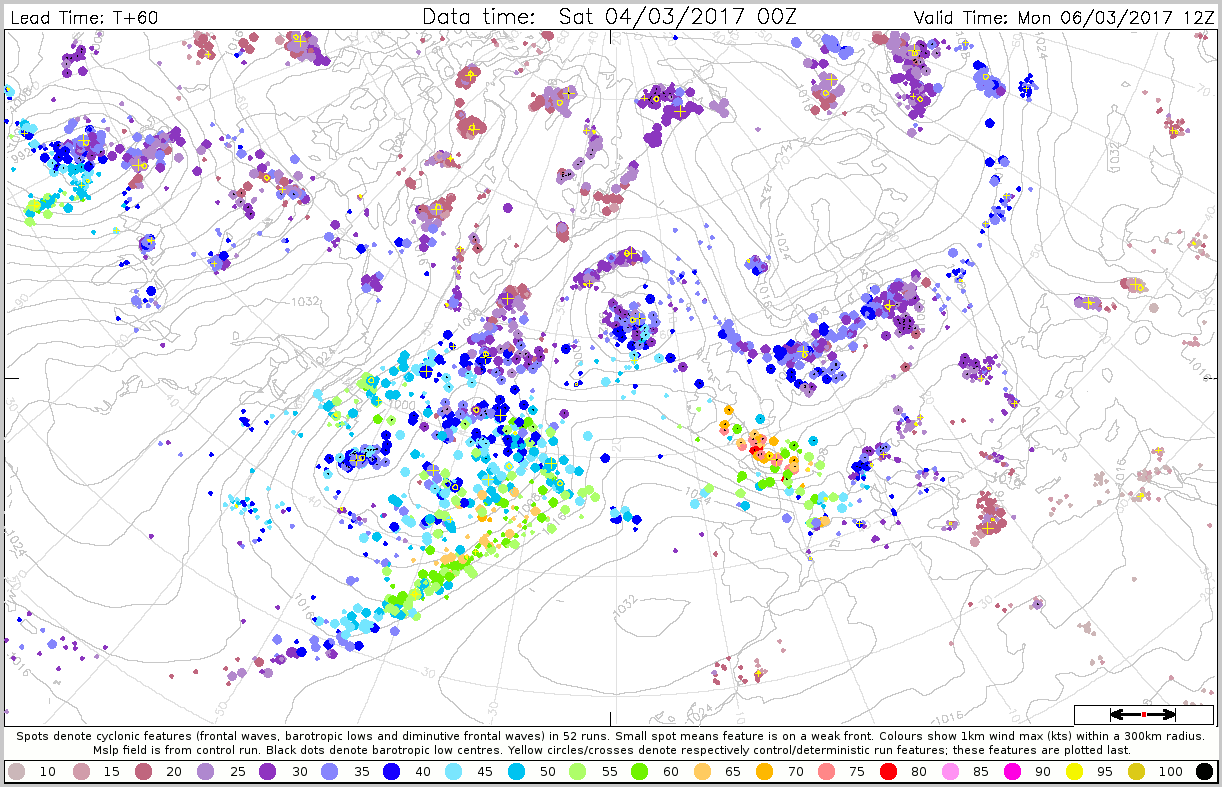
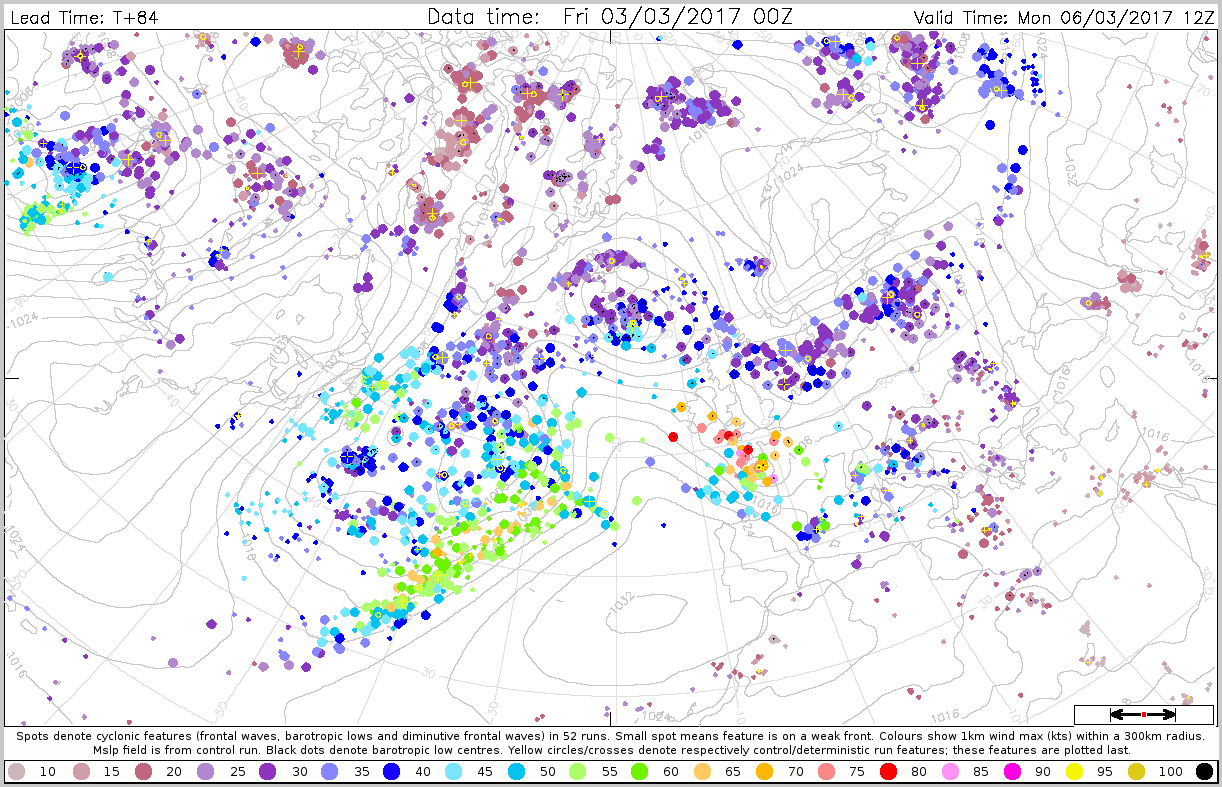
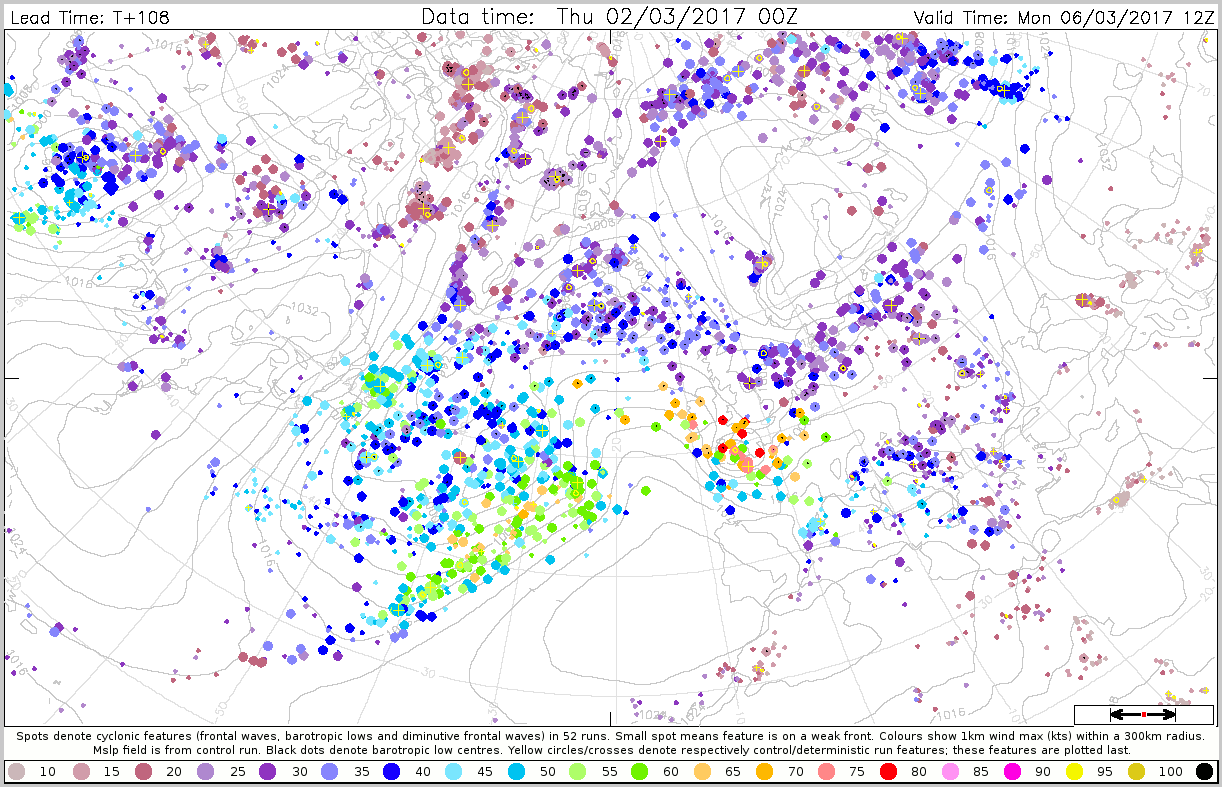
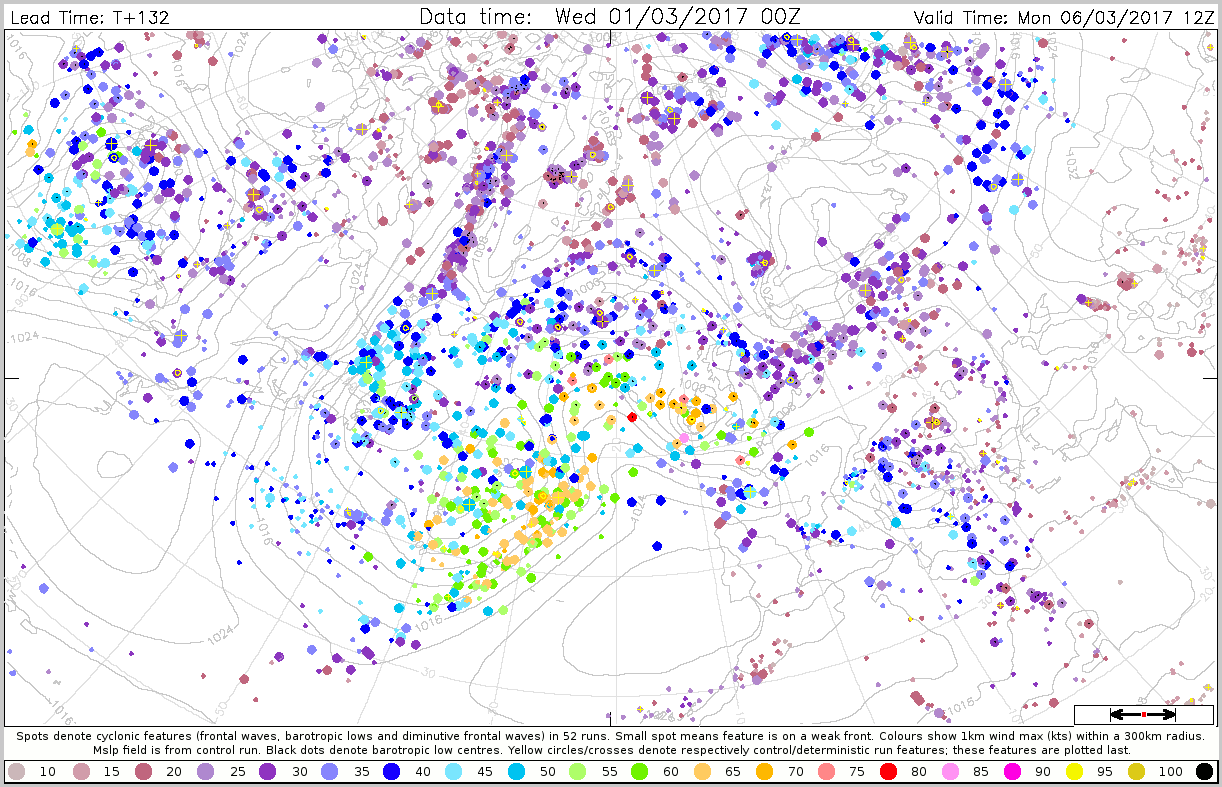
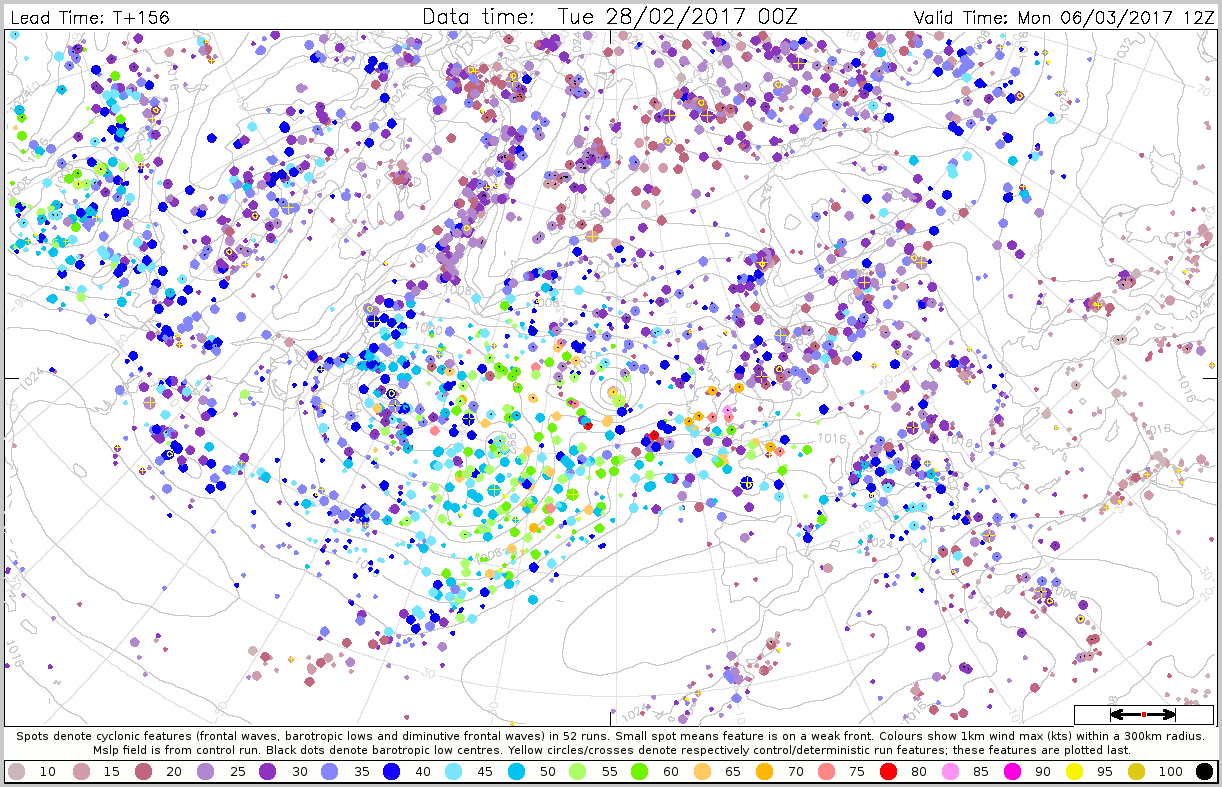
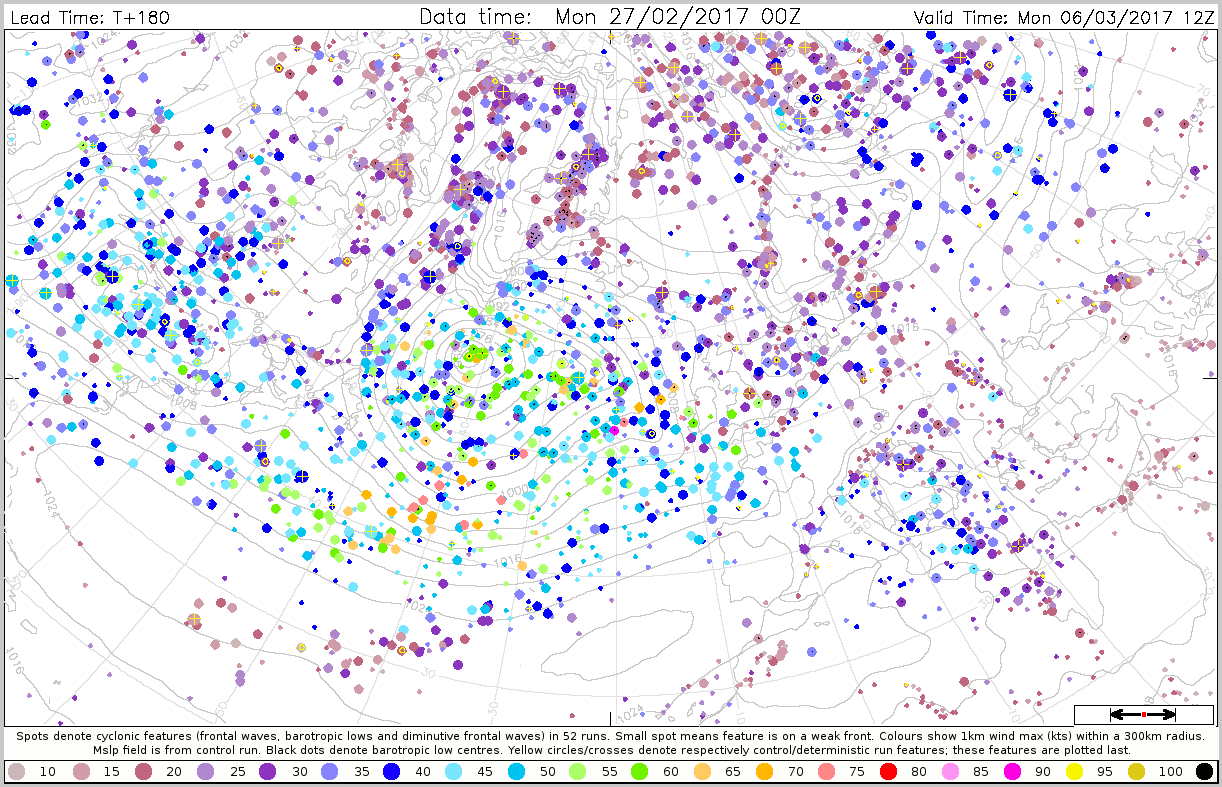
The plots below shows the cyclone feature plots for maximum wind within 300 km radius around the feature. All plots are valid 6 March 12UTC.
3.4 Monthly forecasts
3.5 Comparison with other centres
4. Experience from general performance/other cases
5. Good and bad aspects of the forecasts for the event
- The band of extreme wind gust well captured 4-5 days in advance
- The run from 5 March 00z was bad compared to earlier runs